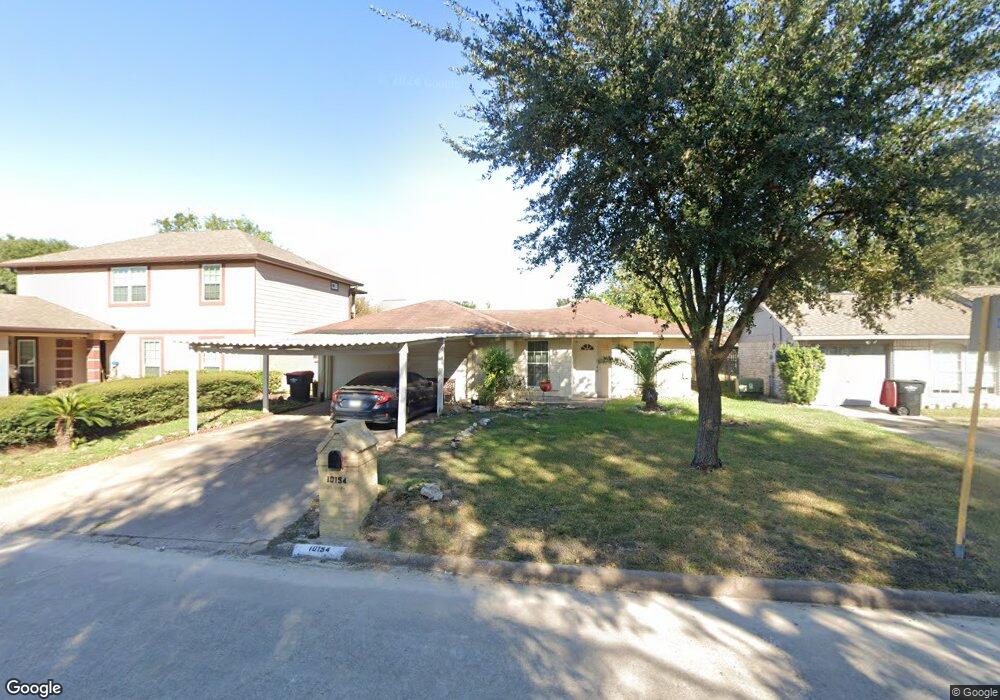
10154 Scotsbrook Dr Houston, TX 77038
North Houston NeighborhoodEstimated Value: $206,010 - $237,000
4
Beds
1
Bath
1,478
Sq Ft
$149/Sq Ft
Est. Value
About This Home
This home is located at 10154 Scotsbrook Dr, Houston, TX 77038 and is currently estimated at $220,503, approximately $149 per square foot. 10154 Scotsbrook Dr is a home located in Harris County with nearby schools including Jerry Keeble Ec/Pre-K, Gray Elementary School, and Aldine Ninth Grade School.
Ownership History
Date
Name
Owned For
Owner Type
Purchase Details
Closed on
May 1, 2015
Sold by
Green Donald E and Green Barbara J
Bought by
Buruca Angel Flores
Current Estimated Value
Home Financials for this Owner
Home Financials are based on the most recent Mortgage that was taken out on this home.
Original Mortgage
$20,000
Interest Rate
3.82%
Mortgage Type
Purchase Money Mortgage
Purchase Details
Closed on
Mar 17, 1999
Sold by
Krolczyk Tony J and Krolczyk Amelia
Bought by
Flores Angel Buruca
Home Financials for this Owner
Home Financials are based on the most recent Mortgage that was taken out on this home.
Original Mortgage
$44,800
Interest Rate
6.74%
Purchase Details
Closed on
Aug 13, 1998
Sold by
Clark Edna G
Bought by
Krolczyk Tony J and Krolczyk Amelia
Home Financials for this Owner
Home Financials are based on the most recent Mortgage that was taken out on this home.
Original Mortgage
$35,400
Interest Rate
6.95%
Mortgage Type
Seller Take Back
Create a Home Valuation Report for This Property
The Home Valuation Report is an in-depth analysis detailing your home's value as well as a comparison with similar homes in the area
Home Values in the Area
Average Home Value in this Area
Purchase History
| Date | Buyer | Sale Price | Title Company |
|---|---|---|---|
| Buruca Angel Flores | -- | None Available | |
| Flores Angel Buruca | -- | American Title Co | |
| Krolczyk Tony J | -- | Texas American Title Company |
Source: Public Records
Mortgage History
| Date | Status | Borrower | Loan Amount |
|---|---|---|---|
| Previous Owner | Buruca Angel Flores | $20,000 | |
| Previous Owner | Flores Angel Buruca | $44,800 | |
| Previous Owner | Krolczyk Tony J | $35,400 |
Source: Public Records
Tax History Compared to Growth
Tax History
| Year | Tax Paid | Tax Assessment Tax Assessment Total Assessment is a certain percentage of the fair market value that is determined by local assessors to be the total taxable value of land and additions on the property. | Land | Improvement |
|---|---|---|---|---|
| 2025 | $1,847 | $202,416 | $32,381 | $170,035 |
| 2024 | $1,847 | $202,416 | $32,381 | $170,035 |
| 2023 | $1,847 | $202,919 | $32,381 | $170,538 |
| 2022 | $3,038 | $159,914 | $25,635 | $134,279 |
| 2021 | $2,880 | $134,095 | $26,175 | $107,920 |
| 2020 | $2,788 | $120,023 | $25,095 | $94,928 |
| 2019 | $2,636 | $111,008 | $25,095 | $85,913 |
| 2018 | $935 | $111,502 | $12,381 | $99,121 |
| 2017 | $2,111 | $111,502 | $12,381 | $99,121 |
| 2016 | $1,919 | $92,873 | $12,381 | $80,492 |
| 2015 | $1,268 | $92,873 | $12,381 | $80,492 |
| 2014 | $1,268 | $76,693 | $12,381 | $64,312 |
Source: Public Records
Map
Nearby Homes
- 10226 Ella Falls Blvd
- 1010 Francitas Dr
- 1006 Fruitvale Dr
- 1022 Progreso Dr
- 939 Point Blank Dr
- 10134 Lasaber Ct
- 1138 Cherry Spring Dr
- 1019 Castolan Dr
- 10026 Lasaber Ct
- 1219 Pilot Point Dr
- 10519 Pleasanton Dr
- 1506 Wilshire Park Dr
- 1327 Fallbrook Dr
- 10558 Pleasanton Dr
- 00 Fallbrook Dr
- 0 W Mt Houston Rd Unit 90464120
- 9710 Debbie Ln
- 2115 Havencrest Dr
- 2203 Chalet Rd
- 12718 Sai Baba Dr
- 10158 Scotsbrook Dr
- 10150 Scotsbrook Dr
- 10155 Ella Blvd
- 10159 Ella Blvd
- 10151 Ella Blvd
- 910 Francitas Dr
- 903 Forestburg Dr
- 10163 Ella Blvd
- 10166 Scotsbrook Dr
- 10146 Scotsbrook Dr
- 10167 Ella Blvd
- 914 Francitas Dr
- 10147 Ella Blvd
- 907 Forestburg Dr
- 10147 Ella Falls Blvd
- 10170 Scotsbrook Dr
- 911 Francitas Dr
- 10142 Scotsbrook Dr
- 10171 Ella Falls Blvd
- 10171 Ella Blvd