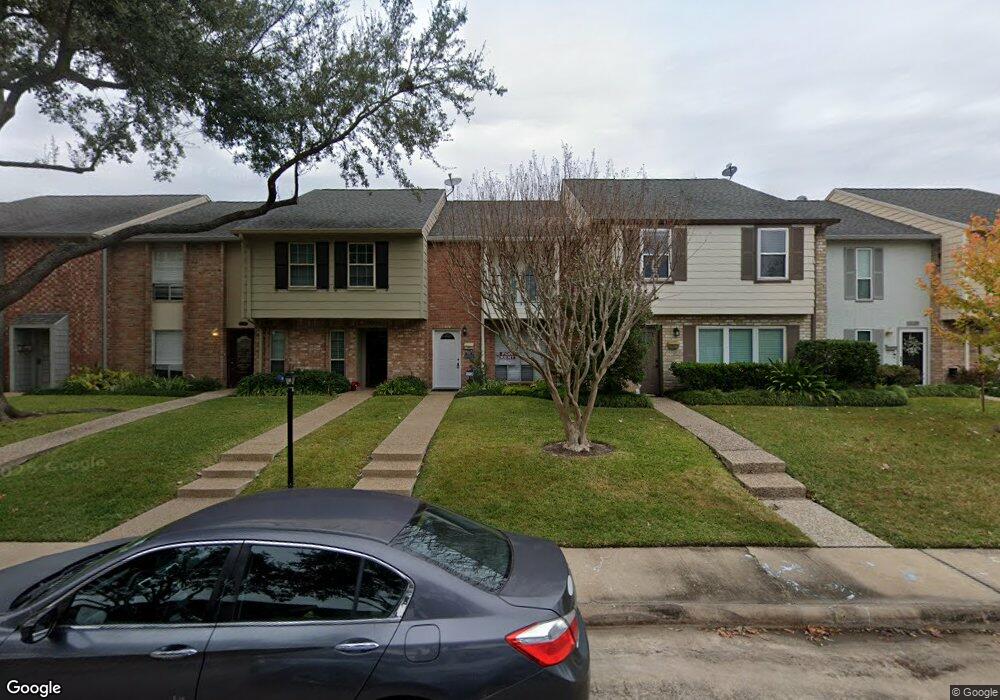
10158 Longmont Dr Unit 38 Houston, TX 77042
Briar Forest NeighborhoodEstimated Value: $214,000 - $240,000
2
Beds
3
Baths
1,258
Sq Ft
$179/Sq Ft
Est. Value
About This Home
This home is located at 10158 Longmont Dr Unit 38, Houston, TX 77042 and is currently estimated at $224,805, approximately $178 per square foot. 10158 Longmont Dr Unit 38 is a home located in Harris County with nearby schools including Walnut Bend Elementary School, Paul Revere Middle School, and Westside High School.
Ownership History
Date
Name
Owned For
Owner Type
Purchase Details
Closed on
Dec 7, 2017
Sold by
Ribcon Margerat Michelle and Rincon Marco
Bought by
Mireno Jessica
Current Estimated Value
Home Financials for this Owner
Home Financials are based on the most recent Mortgage that was taken out on this home.
Original Mortgage
$137,464
Outstanding Balance
$116,647
Interest Rate
4.25%
Mortgage Type
FHA
Estimated Equity
$108,158
Purchase Details
Closed on
Jan 8, 1997
Sold by
Roberts Christine A
Bought by
Rincon Marco and Rincon Margaret Michelle
Home Financials for this Owner
Home Financials are based on the most recent Mortgage that was taken out on this home.
Original Mortgage
$59,823
Interest Rate
7.43%
Mortgage Type
FHA
Create a Home Valuation Report for This Property
The Home Valuation Report is an in-depth analysis detailing your home's value as well as a comparison with similar homes in the area
Home Values in the Area
Average Home Value in this Area
Purchase History
| Date | Buyer | Sale Price | Title Company |
|---|---|---|---|
| Mireno Jessica | -- | None Available | |
| Rincon Marco | -- | First American Title |
Source: Public Records
Mortgage History
| Date | Status | Borrower | Loan Amount |
|---|---|---|---|
| Open | Mireno Jessica | $137,464 | |
| Previous Owner | Rincon Marco | $59,823 |
Source: Public Records
Tax History Compared to Growth
Tax History
| Year | Tax Paid | Tax Assessment Tax Assessment Total Assessment is a certain percentage of the fair market value that is determined by local assessors to be the total taxable value of land and additions on the property. | Land | Improvement |
|---|---|---|---|---|
| 2025 | $2,079 | $182,446 | $65,000 | $117,446 |
| 2024 | $2,079 | $175,800 | $65,000 | $110,800 |
| 2023 | $2,079 | $182,002 | $65,000 | $117,002 |
| 2022 | $3,589 | $163,376 | $65,000 | $98,376 |
| 2021 | $3,454 | $148,188 | $65,000 | $83,188 |
| 2020 | $3,954 | $163,295 | $65,000 | $98,295 |
| 2019 | $4,132 | $163,295 | $65,000 | $98,295 |
| 2018 | $2,940 | $159,361 | $65,000 | $94,361 |
| 2017 | $3,863 | $152,757 | $65,000 | $87,757 |
| 2016 | $3,672 | $145,213 | $65,000 | $80,213 |
| 2015 | $3,028 | $143,785 | $65,000 | $78,785 |
| 2014 | $3,028 | $117,778 | $37,500 | $80,278 |
Source: Public Records
Map
Nearby Homes
- 10212 Longmont Dr Unit 44/7
- 10378 Briar Forest Dr Unit 32/5
- 10324 Briar Forest Dr Unit 28
- 10276 Briar Forest Dr Unit 25
- 10121 Valley Forge Dr
- 10317 Briar Forest Dr Unit 214
- 10118 Briar Rose Dr
- 1537 W Sam Houston Pkwy S
- 10034 Bordley Dr
- 10042 Briar Forest Dr
- 10034 Briar Forest Dr
- 1691 W Sam Houston Pkwy S
- 10323 Pine Forest Rd
- 10010 Bordley Dr
- 1003 Blue Willow Dr
- 10303 Chevy Chase Dr
- 10031 Inwood Dr
- 10614 Lynbrook Dr
- 10211 Olympia Dr
- 10615 Briar Forest Dr Unit 104
- 10158 Longmont Dr Unit 387
- 10160 Longmont Dr Unit 38
- 10160 Longmont Dr Unit 38/6
- 10156 Longmont Dr Unit 38
- 10162 Longmont Dr Unit 38
- 10162 Longmont Dr Unit 385
- 10154 Longmont Dr Unit 38
- 10154 Longmont Dr Unit 38/9
- 10164 Longmont Dr Unit 38
- 10152 Longmont Dr Unit 38
- 10152 Longmont Dr Unit 38/10
- 10150 Longmont Dr Unit 38
- 10150 Longmont Dr Unit 11
- 10166 Longmont Dr Unit 38
- 10168 Longmont Dr Unit 38
- 10168 Longmont Dr Unit 38/2
- 10172 Longmont Dr Unit 43
- 10170 Longmont Dr Unit 38
- 10174 Longmont Dr Unit 43
- 10260 Longmont Dr Unit 41