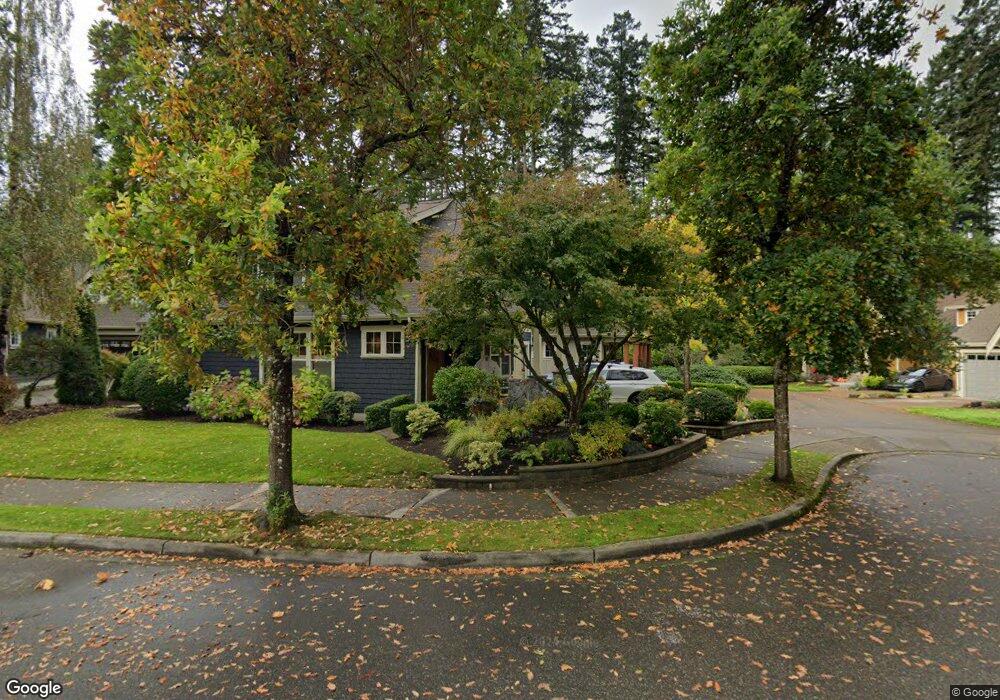
10159 NE Garibaldi Loop Bainbridge Island, WA 98110
Estimated Value: $1,209,482 - $1,360,000
3
Beds
3
Baths
2,580
Sq Ft
$497/Sq Ft
Est. Value
About This Home
This home is located at 10159 NE Garibaldi Loop, Bainbridge Island, WA 98110 and is currently estimated at $1,281,371, approximately $496 per square foot. 10159 NE Garibaldi Loop is a home located in Kitsap County with nearby schools including Bainbridge High School, St. Cecilia Catholic School, and Madrona School.
Ownership History
Date
Name
Owned For
Owner Type
Purchase Details
Closed on
May 23, 2003
Sold by
Tumark Llc
Bought by
Depew Charley F and Depew Laurie D
Current Estimated Value
Home Financials for this Owner
Home Financials are based on the most recent Mortgage that was taken out on this home.
Original Mortgage
$322,700
Outstanding Balance
$139,434
Interest Rate
5.71%
Mortgage Type
Purchase Money Mortgage
Estimated Equity
$1,141,937
Purchase Details
Closed on
Sep 19, 2002
Sold by
Pryor Antone and Pryor Young Oak
Bought by
Tumark Llc
Home Financials for this Owner
Home Financials are based on the most recent Mortgage that was taken out on this home.
Original Mortgage
$357,940
Interest Rate
6.24%
Mortgage Type
Construction
Create a Home Valuation Report for This Property
The Home Valuation Report is an in-depth analysis detailing your home's value as well as a comparison with similar homes in the area
Home Values in the Area
Average Home Value in this Area
Purchase History
| Date | Buyer | Sale Price | Title Company |
|---|---|---|---|
| Depew Charley F | $445,150 | Pacific Nw Title | |
| Tumark Llc | $115,000 | Pacific Nw Title |
Source: Public Records
Mortgage History
| Date | Status | Borrower | Loan Amount |
|---|---|---|---|
| Open | Depew Charley F | $322,700 | |
| Previous Owner | Tumark Llc | $357,940 | |
| Closed | Depew Charley F | $77,900 |
Source: Public Records
Tax History Compared to Growth
Tax History
| Year | Tax Paid | Tax Assessment Tax Assessment Total Assessment is a certain percentage of the fair market value that is determined by local assessors to be the total taxable value of land and additions on the property. | Land | Improvement |
|---|---|---|---|---|
| 2026 | $8,759 | $1,080,840 | $201,000 | $879,840 |
| 2025 | $8,759 | $1,080,840 | $201,000 | $879,840 |
| 2024 | $8,371 | $1,080,840 | $201,000 | $879,840 |
| 2023 | $8,735 | $1,080,840 | $201,000 | $879,840 |
| 2022 | $7,632 | $803,050 | $147,990 | $655,060 |
| 2021 | $7,412 | $743,610 | $136,680 | $606,930 |
| 2020 | $7,512 | $743,610 | $136,680 | $606,930 |
| 2019 | $6,727 | $677,810 | $124,350 | $553,460 |
| 2018 | $6,869 | $590,780 | $107,910 | $482,870 |
| 2017 | $6,176 | $590,780 | $107,910 | $482,870 |
| 2016 | $5,694 | $516,790 | $94,230 | $422,560 |
| 2015 | $4,999 | $461,670 | $94,230 | $367,440 |
| 2014 | -- | $414,430 | $94,230 | $320,200 |
| 2013 | -- | $414,430 | $94,230 | $320,200 |
Source: Public Records
Map
Nearby Homes
- 1349 Nolta Loop NE
- 1351 Nolta Loop NE
- 1322 Polly's Ln
- 1245 High School Rd NE
- 300 High School Rd NE Unit 203
- 300 High School Rd NE Unit 419
- 610 NE Vineyard Ln Unit A104
- 620 NE Vineyard Ln Unit B302
- 752 NE Vineyard Ln Unit L205
- 171 Wallace Way NE Unit B
- 774 Madison Ave N Unit B774
- 9380 Ferncliff Ave NE
- 522 Madrona Way NE Unit 4
- 9641 NE Northtown Loop
- 9418 NE Tidal Ct
- 392 Wills Ln NW
- 0 NE Lofgren (Lot A) Rd
- 224 Canopy Path NW
- 200 Shepard Way NW
- 204 Shepard Way NW
- 10145 NE Garibaldi Loop
- 10131 NE Garibaldi Loop
- 10187 NE Garibaldi Loop Unit 12
- 10187 NE Garibaldi Loop
- 10173 NE Garibaldi Loop Unit 13
- 10173 NE Garibaldi Loop
- 10278 Ruddy Duck Ln
- 10278 Ruddy Duck Ln
- 10152 NE Garibaldi Loop
- 10266 Ruddy Duck Ln
- 10103 NE Garibaldi Loop
- 10184 NE Garibaldi Loop
- 10201 NE Garibaldi Loop
- 10254 Ruddy Duck Ln
- 0 Lot 7 NE Garibaldi Loop
- 0 Lot 3 NE Garibaldi Loop
- 0 Lot 5 NE Garibaldi Loop
- 0 Lot 2 NE Garibaldi Loop
- 0 Lot 4 NE Garibaldi Loop