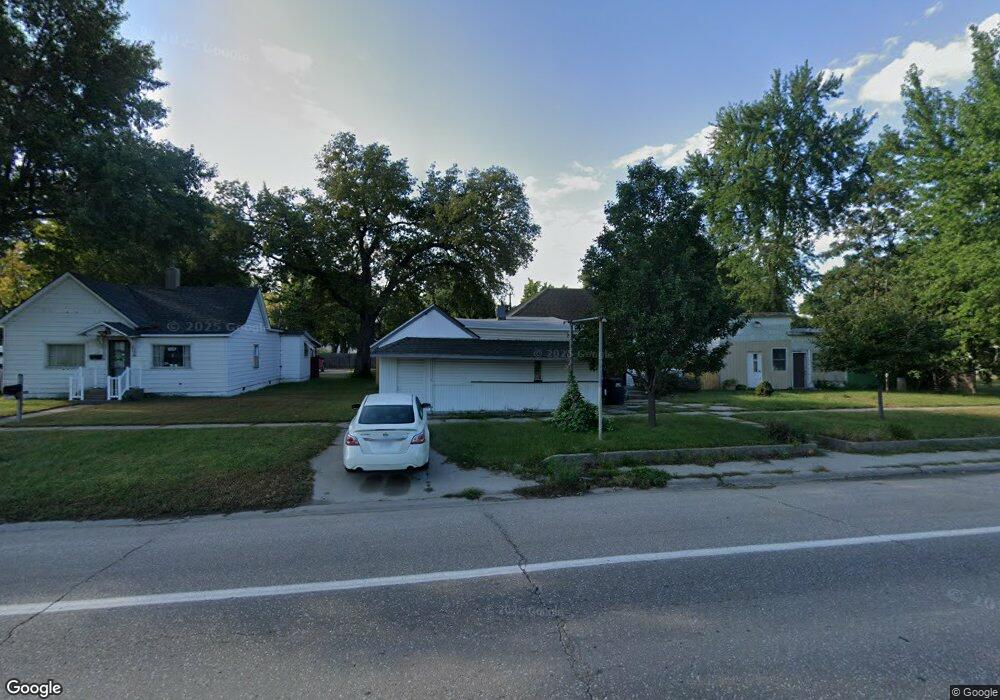
1016 16th St Central City, NE 68826
Estimated Value: $103,000 - $149,000
2
Beds
1
Bath
1,120
Sq Ft
$118/Sq Ft
Est. Value
About This Home
This home is located at 1016 16th St, Central City, NE 68826 and is currently estimated at $132,304, approximately $118 per square foot. 1016 16th St is a home located in Merrick County with nearby schools including Central City Elementary School, Central City Middle School, and Central City High School.
Ownership History
Date
Name
Owned For
Owner Type
Purchase Details
Closed on
Jun 22, 2009
Sold by
Martinez Nelson and Martinez Julio Nelson Medina
Bought by
Santillan Lorenzo and Santillan Martha F
Current Estimated Value
Home Financials for this Owner
Home Financials are based on the most recent Mortgage that was taken out on this home.
Original Mortgage
$15,269
Outstanding Balance
$9,637
Interest Rate
4.83%
Mortgage Type
Future Advance Clause Open End Mortgage
Estimated Equity
$122,667
Purchase Details
Closed on
Jul 3, 2008
Sold by
Shields Sylvia R
Bought by
Martinez Nelson Medina and Martinez Julio Nelson
Create a Home Valuation Report for This Property
The Home Valuation Report is an in-depth analysis detailing your home's value as well as a comparison with similar homes in the area
Home Values in the Area
Average Home Value in this Area
Purchase History
| Date | Buyer | Sale Price | Title Company |
|---|---|---|---|
| Santillan Lorenzo | $16,000 | None Available | |
| Martinez Nelson Medina | -- | None Available |
Source: Public Records
Mortgage History
| Date | Status | Borrower | Loan Amount |
|---|---|---|---|
| Open | Santillan Lorenzo | $15,269 |
Source: Public Records
Tax History Compared to Growth
Tax History
| Year | Tax Paid | Tax Assessment Tax Assessment Total Assessment is a certain percentage of the fair market value that is determined by local assessors to be the total taxable value of land and additions on the property. | Land | Improvement |
|---|---|---|---|---|
| 2025 | $747 | $68,585 | $32,500 | $36,085 |
| 2024 | $747 | $64,210 | $28,125 | $36,085 |
| 2023 | $757 | $52,335 | $16,250 | $36,085 |
| 2022 | $860 | $52,335 | $16,250 | $36,085 |
| 2021 | $657 | $37,965 | $16,250 | $21,715 |
| 2020 | $647 | $37,320 | $16,250 | $21,070 |
| 2019 | $482 | $28,070 | $7,000 | $21,070 |
| 2018 | $483 | $28,070 | $7,000 | $21,070 |
| 2017 | $486 | $28,070 | $7,000 | $21,070 |
| 2016 | $409 | $23,575 | $7,000 | $16,575 |
| 2015 | $440 | $23,575 | $7,000 | $16,575 |
| 2014 | $457 | $23,575 | $7,000 | $16,575 |
| 2012 | $246 | $23,400 | $6,800 | $16,600 |
Source: Public Records
Map
Nearby Homes