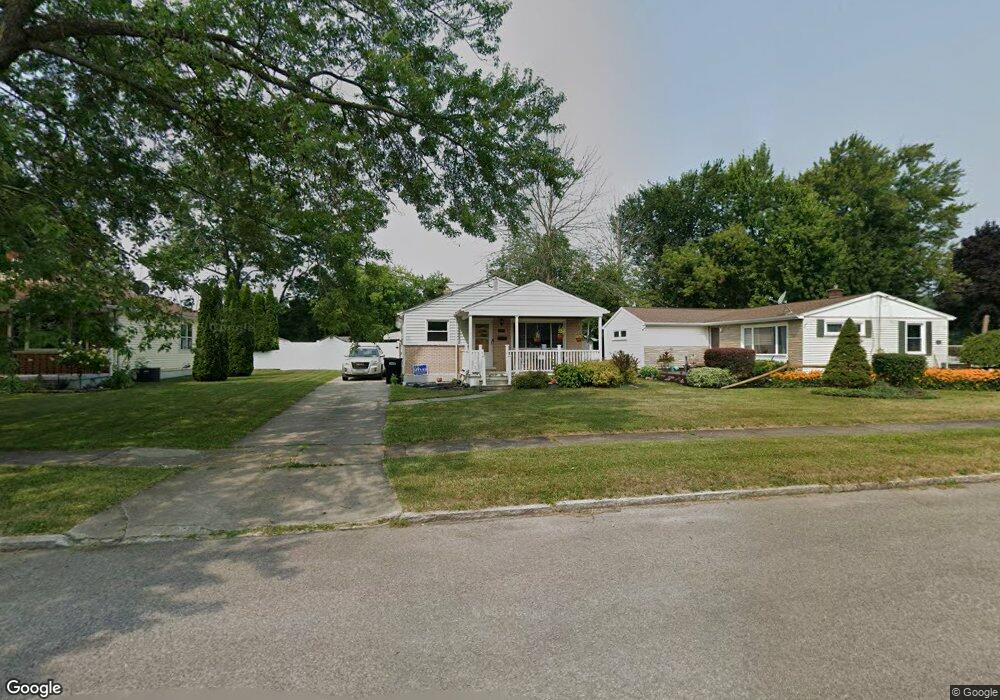
1016 96th St Niagara Falls, NY 14304
LaSalle NeighborhoodEstimated Value: $169,000 - $204,000
3
Beds
1
Bath
1,118
Sq Ft
$171/Sq Ft
Est. Value
About This Home
This home is located at 1016 96th St, Niagara Falls, NY 14304 and is currently estimated at $191,541, approximately $171 per square foot. 1016 96th St is a home located in Niagara County with nearby schools including Niagara Falls High School, Christ the King Preparatory Academy, and Catholic Academy Of Niagara Falls - Elementary.
Ownership History
Date
Name
Owned For
Owner Type
Purchase Details
Closed on
Mar 18, 2011
Sold by
Secretary Of The U S Department Of Housi
Bought by
Rhoney Lisa M
Current Estimated Value
Purchase Details
Closed on
Oct 12, 2010
Sold by
Kavanaugh Evan
Bought by
Secretary Of Housing & Urban Development
Purchase Details
Closed on
Nov 21, 2003
Sold by
King Lawrence J
Bought by
Kavanaugh Evan
Purchase Details
Closed on
Jan 23, 2003
Purchase Details
Closed on
Aug 3, 2001
Create a Home Valuation Report for This Property
The Home Valuation Report is an in-depth analysis detailing your home's value as well as a comparison with similar homes in the area
Home Values in the Area
Average Home Value in this Area
Purchase History
| Date | Buyer | Sale Price | Title Company |
|---|---|---|---|
| Rhoney Lisa M | $35,825 | None Available | |
| Secretary Of Housing & Urban Development | $63,908 | None Available | |
| Kavanaugh Evan | $57,800 | Michael J Violante | |
| -- | -- | -- | |
| -- | -- | -- |
Source: Public Records
Tax History Compared to Growth
Tax History
| Year | Tax Paid | Tax Assessment Tax Assessment Total Assessment is a certain percentage of the fair market value that is determined by local assessors to be the total taxable value of land and additions on the property. | Land | Improvement |
|---|---|---|---|---|
| 2024 | $3,578 | $67,000 | $3,700 | $63,300 |
| 2023 | $1,990 | $67,000 | $3,700 | $63,300 |
| 2022 | $1,566 | $67,000 | $3,700 | $63,300 |
| 2021 | $1,542 | $67,000 | $3,700 | $63,300 |
| 2020 | $1,086 | $67,000 | $3,700 | $63,300 |
| 2019 | $1,248 | $67,000 | $3,700 | $63,300 |
| 2018 | $1,453 | $67,000 | $3,700 | $63,300 |
| 2017 | $1,248 | $67,000 | $3,700 | $63,300 |
| 2016 | $1,730 | $67,000 | $3,700 | $63,300 |
| 2015 | -- | $67,000 | $3,700 | $63,300 |
| 2014 | -- | $67,000 | $3,700 | $63,300 |
Source: Public Records
Map
Nearby Homes