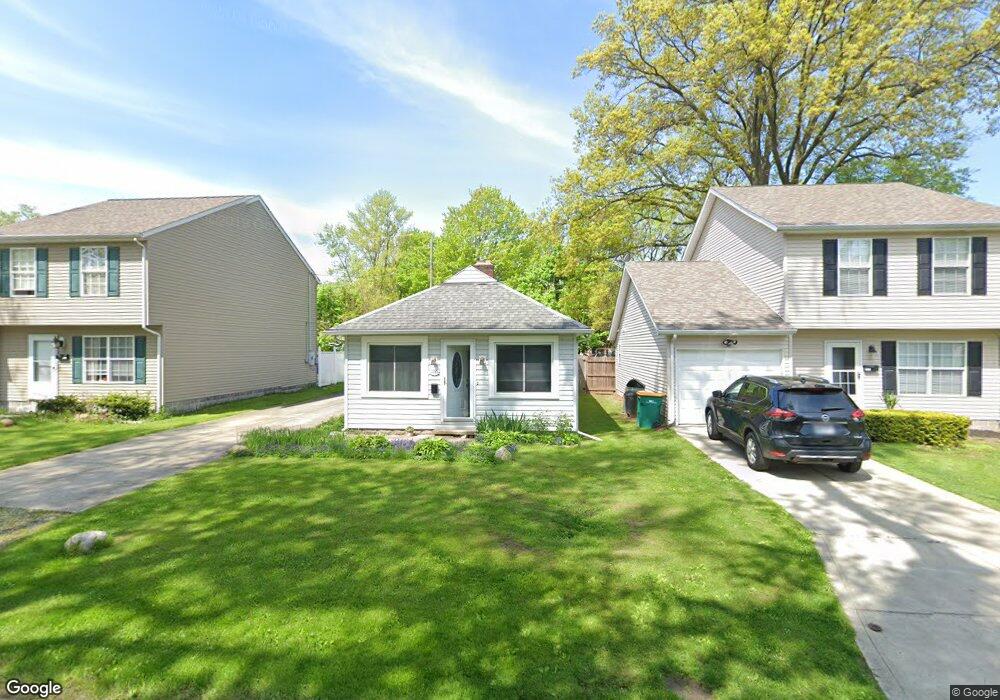
1016 Cherokee Trail Willoughby, OH 44094
Estimated Value: $117,000 - $147,000
3
Beds
1
Bath
800
Sq Ft
$164/Sq Ft
Est. Value
About This Home
This home is located at 1016 Cherokee Trail, Willoughby, OH 44094 and is currently estimated at $131,403, approximately $164 per square foot. 1016 Cherokee Trail is a home located in Lake County with nearby schools including Grant Elementary School, Willoughby Middle School, and South High School.
Ownership History
Date
Name
Owned For
Owner Type
Purchase Details
Closed on
Nov 23, 2010
Sold by
Bulldog Holdings 2009 Llc
Bought by
Curry Danielle
Current Estimated Value
Home Financials for this Owner
Home Financials are based on the most recent Mortgage that was taken out on this home.
Original Mortgage
$58,216
Outstanding Balance
$38,442
Interest Rate
4.75%
Mortgage Type
FHA
Estimated Equity
$92,961
Purchase Details
Closed on
Dec 18, 2009
Sold by
Joe & Bob 2004 Llc and Lucas Joe
Bought by
Bulldog Holdings 2009 Llc
Purchase Details
Closed on
Feb 6, 2009
Sold by
Blaney Bob
Bought by
Joe & Bob 2004 Llc
Purchase Details
Closed on
Sep 25, 2008
Sold by
Avelo Mortgage Llc
Bought by
Blaney Robert
Purchase Details
Closed on
Feb 7, 2008
Sold by
Richards Cynthia B and Dougher Cynthia B
Bought by
Avelo Mortgage Llc
Create a Home Valuation Report for This Property
The Home Valuation Report is an in-depth analysis detailing your home's value as well as a comparison with similar homes in the area
Home Values in the Area
Average Home Value in this Area
Purchase History
| Date | Buyer | Sale Price | Title Company |
|---|---|---|---|
| Curry Danielle | $59,000 | Enterprise Title Agency Inc | |
| Bulldog Holdings 2009 Llc | -- | Enterprise Title | |
| Joe & Bob 2004 Llc | -- | Enterprise Title | |
| Blaney Robert | $30,900 | Prism Title & Closing Servic | |
| Avelo Mortgage Llc | $79,000 | None Available |
Source: Public Records
Mortgage History
| Date | Status | Borrower | Loan Amount |
|---|---|---|---|
| Open | Curry Danielle | $58,216 |
Source: Public Records
Tax History
| Year | Tax Paid | Tax Assessment Tax Assessment Total Assessment is a certain percentage of the fair market value that is determined by local assessors to be the total taxable value of land and additions on the property. | Land | Improvement |
|---|---|---|---|---|
| 2025 | -- | $38,100 | $9,280 | $28,820 |
| 2024 | -- | $38,100 | $9,280 | $28,820 |
| 2023 | $3,045 | $32,160 | $7,860 | $24,300 |
| 2022 | $1,997 | $32,160 | $7,860 | $24,300 |
| 2021 | $2,005 | $32,160 | $7,860 | $24,300 |
| 2020 | $1,847 | $26,360 | $6,440 | $19,920 |
| 2019 | $1,715 | $26,360 | $6,440 | $19,920 |
| 2018 | $1,545 | $20,480 | $9,280 | $11,200 |
| 2017 | $1,403 | $20,480 | $9,280 | $11,200 |
| 2016 | $1,398 | $20,480 | $9,280 | $11,200 |
| 2015 | $1,332 | $20,480 | $9,280 | $11,200 |
| 2014 | $1,231 | $19,950 | $9,280 | $10,670 |
| 2013 | $1,232 | $19,950 | $9,280 | $10,670 |
Source: Public Records
Map
Nearby Homes
- 6491 Seminole Trail
- 7127 Lake Shore Blvd
- 7145 Lake Shore Blvd
- 6426 Southgrove Rd
- 722 Chestnut Blvd
- 1053 Peach Blvd
- 7090 Comanche Trail
- 1086 Peach Blvd
- 38606 Granite Dr Unit 28
- 38604 Granite Dr Unit 29
- 6147 Iroquois Trail
- 1040 Windermere Dr
- VL#2 Oak St
- 7300 Olde Farm Ln
- VL#1 Oak St
- 38256 Lake Shore Blvd
- 38450 Crossbrook Ave
- 6483 Carter Blvd
- 6035 Campbell Rd
- 0 V L Lake Shore Blvd Unit 5070796
- 1012 Cherokee Trail
- 1024 Cherokee Trail
- 1004 Cherokee Trail
- 1011 Tioga Trail
- 1023 Tioga Trail
- 1032 Cherokee Trail
- 1005 Tioga Trail
- 1017 Cherokee Trail
- 1025 Cherokee Trail
- 999 Tioga Trail
- 1041 Tioga Trail
- 992 Cherokee Trail
- 1042 Cherokee Trail
- 1005 Cherokee Trail
- 1043 Cherokee Trail
- 987 Tioga Trail
- 1047 Tioga Trail
- 983 Cherokee Trail
- 6444 Iroquois Trail
- 1012 Tioga Trail
Your Personal Tour Guide
Ask me questions while you tour the home.