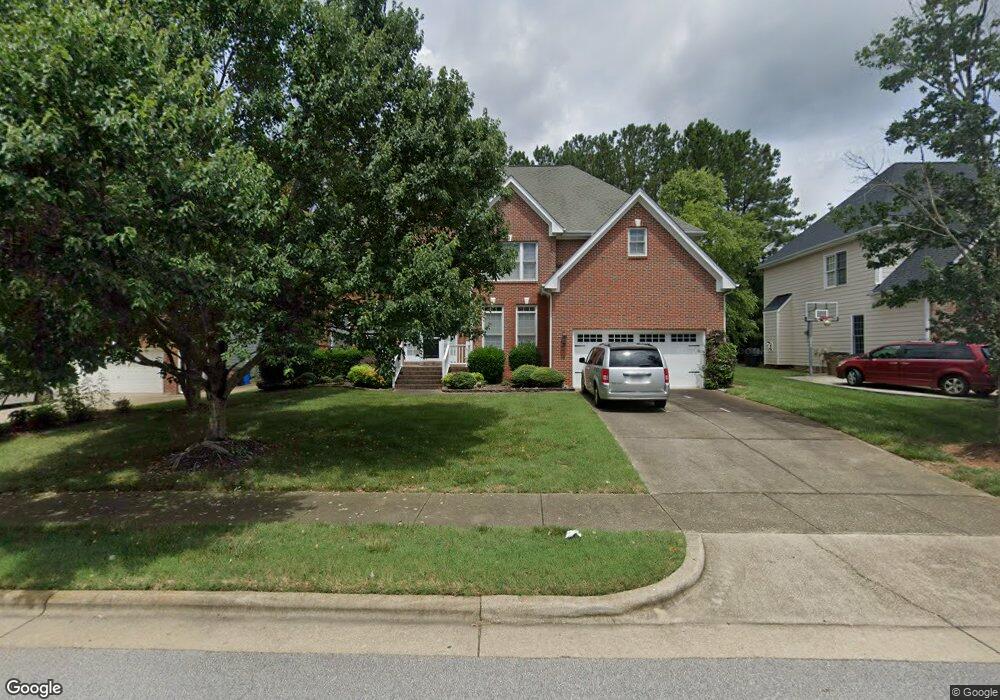
1016 Clatter Ave Wake Forest, NC 27587
Falls Lake NeighborhoodEstimated Value: $589,084 - $820,000
5
Beds
4
Baths
3,454
Sq Ft
$193/Sq Ft
Est. Value
About This Home
This home is located at 1016 Clatter Ave, Wake Forest, NC 27587 and is currently estimated at $667,271, approximately $193 per square foot. 1016 Clatter Ave is a home located in Wake County with nearby schools including Forest Pines Drive Elementary School, Wake Forest-Rolesville Middle School, and Wake Forest High School.
Ownership History
Date
Name
Owned For
Owner Type
Purchase Details
Closed on
Feb 13, 2025
Sold by
Obrien Aileen and Obrien Angela
Bought by
Angela Trust and Obrien
Current Estimated Value
Purchase Details
Closed on
May 2, 2007
Sold by
Obrien Aileen
Bought by
Obrien Angela and Obrien Aileen
Purchase Details
Closed on
Jun 8, 2006
Sold by
Obrien Angela
Bought by
Obrien Aileen
Purchase Details
Closed on
Apr 28, 2003
Sold by
St Lawrence Homes Inc
Bought by
Obrien Aileen and Obrien Angela
Home Financials for this Owner
Home Financials are based on the most recent Mortgage that was taken out on this home.
Original Mortgage
$252,800
Interest Rate
4.12%
Purchase Details
Closed on
Aug 20, 2002
Sold by
Crenshaw Hall Associates Inc
Bought by
St Lawrence Homes Inc
Create a Home Valuation Report for This Property
The Home Valuation Report is an in-depth analysis detailing your home's value as well as a comparison with similar homes in the area
Home Values in the Area
Average Home Value in this Area
Purchase History
| Date | Buyer | Sale Price | Title Company |
|---|---|---|---|
| Angela Trust | -- | None Listed On Document | |
| Angela Trust | -- | None Listed On Document | |
| Obrien Angela | -- | None Available | |
| Obrien Aileen | -- | None Available | |
| Obrien Aileen | $316,000 | -- | |
| St Lawrence Homes Inc | $50,500 | -- |
Source: Public Records
Mortgage History
| Date | Status | Borrower | Loan Amount |
|---|---|---|---|
| Previous Owner | Obrien Aileen | $252,800 |
Source: Public Records
Tax History
| Year | Tax Paid | Tax Assessment Tax Assessment Total Assessment is a certain percentage of the fair market value that is determined by local assessors to be the total taxable value of land and additions on the property. | Land | Improvement |
|---|---|---|---|---|
| 2025 | $5,450 | $566,538 | $100,000 | $466,538 |
| 2024 | $5,430 | $566,538 | $100,000 | $466,538 |
Source: Public Records
Map
Nearby Homes
- 1000 Dairy House Ct
- 1413 Flemming House St
- 1417 Flemming House St
- 1005 Martin Bench Ct
- 1516 Crenshaw Point
- 1100 Washhouse Ln
- 103 Fawn Dr
- 12347 Honeychurch St
- 12554 Honeychurch St
- 3064 Imperial Oaks Dr
- 11072 Ligon Mill Rd Unit 200 - Julianne
- 12212 Ashton Woods Ln
- 12014 Fox Valley St
- 7029 Moresham Way
- 1147 Blue Bird Ln Unit 1147
- 7709 Kittinger Ct
- 2428 Rachel Dr
- 2705 Peachleaf St
- 12005 Jasmine Cove Way
- 733 Bennett Ridge Ct
- 1020 Clatter Ave
- 1019 Federal House Ave
- 1023 Federal House Ave
- 1024 Clatter Ave
- 1017 Clatter Ave
- 1021 Clatter Ave
- 1013 Clatter Ave
- 1028 Clatter Ave
- 1027 Federal House Ave
- 1009 Clatter Ave
- 1100 Clatter Ave
- 1104 Clatter Ave
- 1008 Dairy House Ct
- 1012 Dairy House Ct
- 1004 Dairy House Ct
- 1005 Clatter Ave
- 1020 Federal House Ave
- 1108 Clatter Ave
- 1016 Federal House Ave
- 1024 Federal House Ave
Your Personal Tour Guide
Ask me questions while you tour the home.