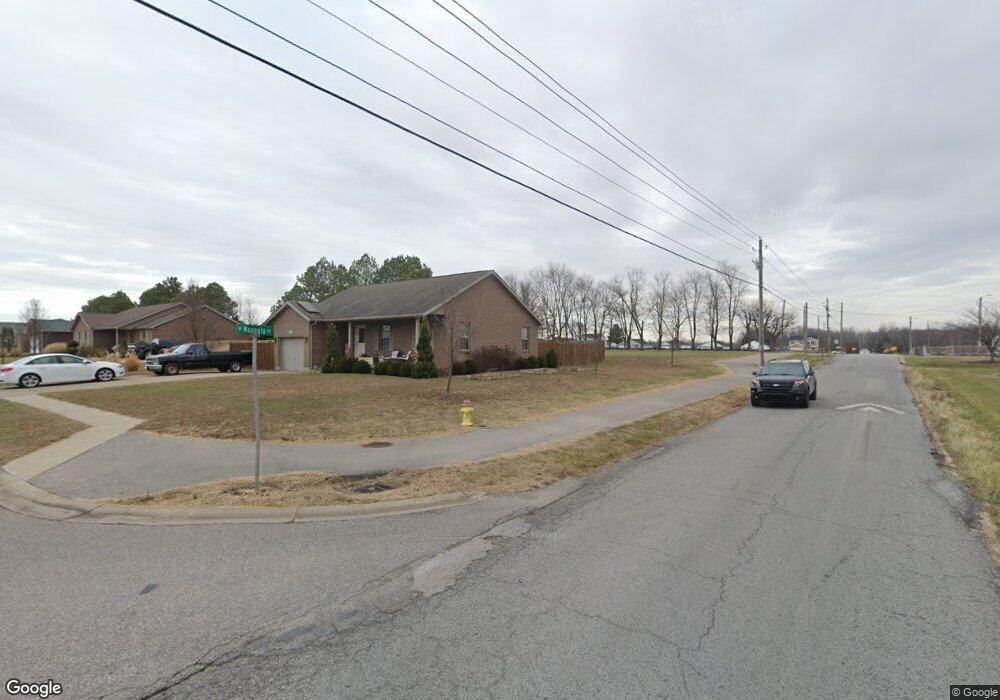
1016 Eclipse St Scottsburg, IN 47170
Estimated Value: $198,554 - $242,000
3
Beds
2
Baths
1,097
Sq Ft
$200/Sq Ft
Est. Value
About This Home
This home is located at 1016 Eclipse St, Scottsburg, IN 47170 and is currently estimated at $219,139, approximately $199 per square foot. 1016 Eclipse St is a home.
Ownership History
Date
Name
Owned For
Owner Type
Purchase Details
Closed on
Mar 14, 2012
Sold by
Not Provided
Bought by
Duckwall Michael E and Duckwall Rachel A
Current Estimated Value
Home Financials for this Owner
Home Financials are based on the most recent Mortgage that was taken out on this home.
Original Mortgage
$14,489
Outstanding Balance
$9,967
Interest Rate
3.9%
Mortgage Type
New Conventional
Estimated Equity
$209,172
Purchase Details
Closed on
Sep 14, 2011
Sold by
Scott County Development Inc
Bought by
The Jamison Group Llc
Create a Home Valuation Report for This Property
The Home Valuation Report is an in-depth analysis detailing your home's value as well as a comparison with similar homes in the area
Home Values in the Area
Average Home Value in this Area
Purchase History
| Date | Buyer | Sale Price | Title Company |
|---|---|---|---|
| Duckwall Michael E | $122,000 | Signature Title Llc | |
| Duckwall Michael E | -- | None Available | |
| The Jamison Group Llc | -- | None Available |
Source: Public Records
Mortgage History
| Date | Status | Borrower | Loan Amount |
|---|---|---|---|
| Open | Duckwall Michael E | $14,489 |
Source: Public Records
Tax History
| Year | Tax Paid | Tax Assessment Tax Assessment Total Assessment is a certain percentage of the fair market value that is determined by local assessors to be the total taxable value of land and additions on the property. | Land | Improvement |
|---|---|---|---|---|
| 2024 | $1,687 | $168,700 | $27,500 | $141,200 |
| 2023 | $1,696 | $169,600 | $27,500 | $142,100 |
| 2022 | $1,646 | $164,600 | $27,500 | $137,100 |
| 2021 | $1,514 | $151,400 | $27,500 | $123,900 |
| 2020 | $1,521 | $150,800 | $27,500 | $123,300 |
| 2019 | $1,535 | $152,200 | $27,500 | $124,700 |
| 2018 | $1,251 | $124,000 | $19,000 | $105,000 |
| 2017 | $1,226 | $121,900 | $19,000 | $102,900 |
| 2016 | $1,157 | $117,900 | $19,000 | $98,900 |
| 2014 | $1,178 | $118,700 | $19,800 | $98,900 |
| 2013 | $1,178 | $118,700 | $19,800 | $98,900 |
Source: Public Records
Map
Nearby Homes
- 1063 Eclipse St
- 1381 Onyx Ave
- 1474 N Solar St Unit LOT 3
- 1478 N Solar St Unit LOT 4
- 1523 Omega Ct
- 973 Wooded Trail
- 975 Wooded Trail
- 1181 N Pine St
- 1557 Willow Ct
- 134 N Chipaway Ln
- 1230 Woodland Ave
- 10 Thomas Ct
- 2207 W Robin Rd
- 590 Lynhurst Dr
- 2116 W State Road 56
- 476 N Meridian St
- 512 W Owen St
- 4805 S US Highway 31
- 358 S Oak St
- 835 Allen St
- 1028 Eclipse St
- 1355 W Moonglo Rd
- 1015 Eclipse St
- 1027 Eclipse St
- 1052 Eclipse St
- 1039 Eclipse St
- 0 Eclipse St Unit 200801747
- 0 Eclipse St Unit 200908328
- 1051 Eclipse St
- 1064 Eclipse St
- 1438 W Moonglo Rd
- 1076 Eclipse St
- 1075 Eclipse St
- 1088 Eclipse St
- 1147 Grissom Ct
- 1335 Graham Blvd
- 1100 Eclipse St
- 1319 Graham Blvd
- 1099 Eclipse St
- 1301 Graham Blvd
Your Personal Tour Guide
Ask me questions while you tour the home.