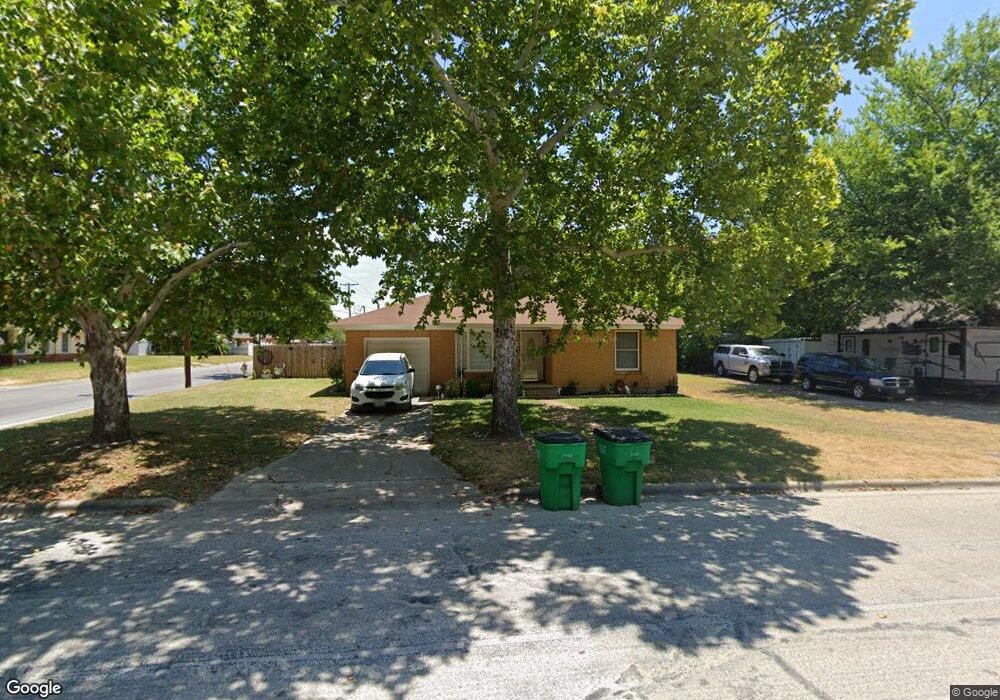
1016 Fair Ave Gainesville, TX 76240
Estimated Value: $153,000 - $190,000
2
Beds
1
Bath
997
Sq Ft
$170/Sq Ft
Est. Value
About This Home
This home is located at 1016 Fair Ave, Gainesville, TX 76240 and is currently estimated at $169,763, approximately $170 per square foot. 1016 Fair Ave is a home located in Cooke County with nearby schools including Edison Elementary School, W.E. Chalmers Elementary School, and Gainesville Intermediate School.
Ownership History
Date
Name
Owned For
Owner Type
Purchase Details
Closed on
Apr 23, 2025
Sold by
Church Of God
Bought by
Rockin V Investments Llc
Current Estimated Value
Purchase Details
Closed on
Jul 23, 2024
Sold by
Storms Callie Brianne and Boxell Grant
Bought by
Moerschell Zack
Purchase Details
Closed on
Mar 27, 2019
Sold by
Mcknight Vickie and Knabe Vickie
Bought by
Clark Vicky L
Home Financials for this Owner
Home Financials are based on the most recent Mortgage that was taken out on this home.
Original Mortgage
$69,937
Interest Rate
4.3%
Mortgage Type
New Conventional
Purchase Details
Closed on
Aug 15, 2005
Sold by
Bunyard A Wayne and Bunyard Fredda L
Bought by
Mcknight Vickie
Home Financials for this Owner
Home Financials are based on the most recent Mortgage that was taken out on this home.
Original Mortgage
$48,600
Interest Rate
5.65%
Mortgage Type
Seller Take Back
Create a Home Valuation Report for This Property
The Home Valuation Report is an in-depth analysis detailing your home's value as well as a comparison with similar homes in the area
Home Values in the Area
Average Home Value in this Area
Purchase History
| Date | Buyer | Sale Price | Title Company |
|---|---|---|---|
| Rockin V Investments Llc | -- | Freedom Title | |
| Moerschell Zack | -- | Howeth Title | |
| Clark Vicky L | -- | Howeth Title Company | |
| Mcknight Vickie | -- | -- |
Source: Public Records
Mortgage History
| Date | Status | Borrower | Loan Amount |
|---|---|---|---|
| Previous Owner | Clark Vicky L | $69,937 | |
| Previous Owner | Mcknight Vickie | $48,600 |
Source: Public Records
Tax History Compared to Growth
Tax History
| Year | Tax Paid | Tax Assessment Tax Assessment Total Assessment is a certain percentage of the fair market value that is determined by local assessors to be the total taxable value of land and additions on the property. | Land | Improvement |
|---|---|---|---|---|
| 2025 | $1,403 | $131,261 | $40,700 | $103,056 |
| 2024 | $1,403 | $143,756 | $40,700 | $103,056 |
| 2023 | $2,128 | $108,480 | $37,000 | $106,212 |
| 2022 | $2,147 | $124,075 | $33,000 | $91,075 |
| 2021 | $2,309 | $91,633 | $22,000 | $69,633 |
| 2020 | $2,164 | $81,503 | $21,000 | $60,503 |
| 2019 | $1,725 | $72,575 | $21,000 | $51,575 |
| 2018 | $1,566 | $57,386 | $10,500 | $46,886 |
| 2017 | $1,501 | $55,194 | $10,500 | $44,694 |
| 2015 | $1,192 | $52,213 | $10,500 | $41,713 |
| 2014 | $1,192 | $52,020 | $10,500 | $41,520 |
Source: Public Records
Map
Nearby Homes
- 1102 Fair Ave
- 1016 N Howeth St
- 1113 Fair Ave
- 1109 Elmwood St
- 1520 Olive St
- 00 O'Neal St
- 1907 Woodlawn Ct
- 1112 Hillside Dr
- 705 Fair Ave
- 1305 Hillcrest Blvd
- 1306 N Clements St
- 811 Ritchey St
- 805 Ritchey St
- 2002 Everglade Dr
- 802 Myrtle St
- 1212 Aspen Rd
- 1010 Aspen Rd
- 2005 Maplewood Dr
- 901 N Morris St
- 418 Hillside Dr
- 1030 Fair Ave
- 1708 Oneal St
- 1012 Fair Ave
- 1710 Oneal St
- 1101 Fair Ave
- 1103 Fair Ave
- 1016 Gladney St
- 1010 Fair Ave
- 1012 Gladney St
- 1101 Belmont St
- 1105 Fair Ave
- 1106 Fair Ave
- 1010 Gladney St
- 1103 Belmont St
- 1102 N Howeth St
- 1008 Gladney St
- 1105 Belmont St
- 1104 N Howeth St
- 1108 Fair Ave
- 1006 Gladney St