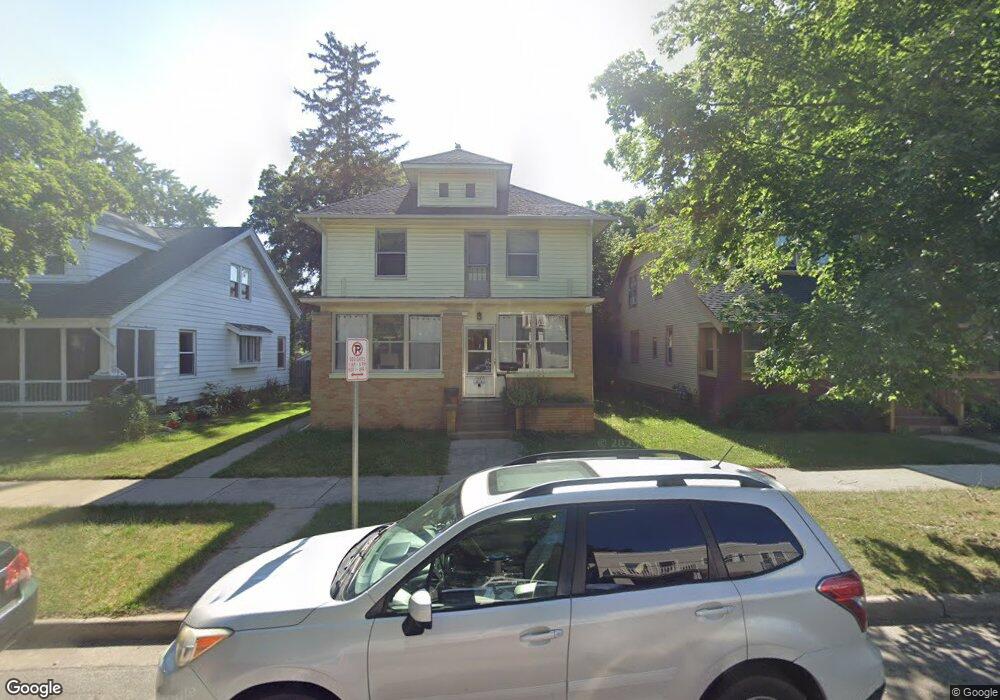
1016 Fremont Ave NW Grand Rapids, MI 49504
West Grand NeighborhoodEstimated Value: $269,000 - $347,000
2
Beds
1
Bath
1,000
Sq Ft
$299/Sq Ft
Est. Value
About This Home
This home is located at 1016 Fremont Ave NW, Grand Rapids, MI 49504 and is currently estimated at $298,700, approximately $298 per square foot. 1016 Fremont Ave NW is a home located in Kent County with nearby schools including Westwood Middle School, Union High School, and NexTech High School.
Ownership History
Date
Name
Owned For
Owner Type
Purchase Details
Closed on
Feb 20, 2017
Sold by
Janowiak Josh and Sorrell Coutney
Bought by
Pike Proeites Llc
Current Estimated Value
Purchase Details
Closed on
Sep 30, 2016
Sold by
Blok Karen and Zeemering Karen
Bought by
Janowiak Josh and Sorrell Courtney
Home Financials for this Owner
Home Financials are based on the most recent Mortgage that was taken out on this home.
Original Mortgage
$65,250
Interest Rate
3.43%
Mortgage Type
Commercial
Purchase Details
Closed on
Oct 2, 2009
Sold by
Zeemering Karen
Bought by
Zeemering Karen
Purchase Details
Closed on
May 12, 1998
Sold by
Joling Joling W W and Joling W
Bought by
Zeemering Karen
Create a Home Valuation Report for This Property
The Home Valuation Report is an in-depth analysis detailing your home's value as well as a comparison with similar homes in the area
Home Values in the Area
Average Home Value in this Area
Purchase History
| Date | Buyer | Sale Price | Title Company |
|---|---|---|---|
| Pike Proeites Llc | -- | None Available | |
| Janowiak Josh | $87,000 | None Available | |
| Zeemering Karen | -- | None Available | |
| Zeemering Karen | -- | -- |
Source: Public Records
Mortgage History
| Date | Status | Borrower | Loan Amount |
|---|---|---|---|
| Previous Owner | Janowiak Josh | $65,250 |
Source: Public Records
Tax History Compared to Growth
Tax History
| Year | Tax Paid | Tax Assessment Tax Assessment Total Assessment is a certain percentage of the fair market value that is determined by local assessors to be the total taxable value of land and additions on the property. | Land | Improvement |
|---|---|---|---|---|
| 2025 | $2,878 | $144,600 | $0 | $0 |
| 2024 | $2,878 | $131,700 | $0 | $0 |
| 2023 | $2,751 | $118,800 | $0 | $0 |
| 2022 | $2,714 | $97,900 | $0 | $0 |
| 2021 | $2,644 | $87,400 | $0 | $0 |
| 2020 | $2,556 | $77,100 | $0 | $0 |
| 2019 | $2,617 | $61,100 | $0 | $0 |
| 2018 | $2,655 | $50,200 | $0 | $0 |
| 2017 | $2,048 | $42,200 | $0 | $0 |
| 2016 | $1,859 | $38,200 | $0 | $0 |
| 2015 | $1,771 | $38,200 | $0 | $0 |
| 2013 | -- | $34,500 | $0 | $0 |
Source: Public Records
Map
Nearby Homes
- 1027 Jennette Ave NW
- 1032 Jennette Ave NW
- 1014 Jennette Ave NW
- 855 Alpine Ave NW
- 936 Mcreynolds Ave NW
- 705 11th St NW
- 1020 10th St NW
- 914 Courtney St NW
- 638 11th St NW
- 1044 Muskegon Ave NW Unit 1 & 2
- 964 Lincoln Ave NW
- 734 Crosby St NW
- 1115 Atlantic St NW
- 912 Arianna St NW
- 1253 Muskegon Ave NW
- 1054 Crosby St NW
- 941 Arianna St NW
- 1200 Leonard St NW
- 1105 Crosby St NW
- 921 4th St NW
- 1022 Fremont Ave NW
- 1014 Fremont Ave NW
- 1014 Fremont Ave NW Unit 2
- 1026 Fremont Ave NW
- 855 11th St NW
- 1030 Fremont Ave NW
- 1019 Jennette Ave NW
- 859 11th St NW
- 851 11th St NW
- 1015 Jennette Ave NW
- 1023 Jennette Ave NW
- 1011 Jennette Ave NW
- 1034 Fremont Ave NW
- 845 11th St NW
- 1031 Jennette Ave NW
- 1007 Jennette Ave NW
- 1013 Fremont Ave NW
- 1013 Fremont Ave NW Unit 1015
- 869 11th St NW
- 869 11th St NW Unit A