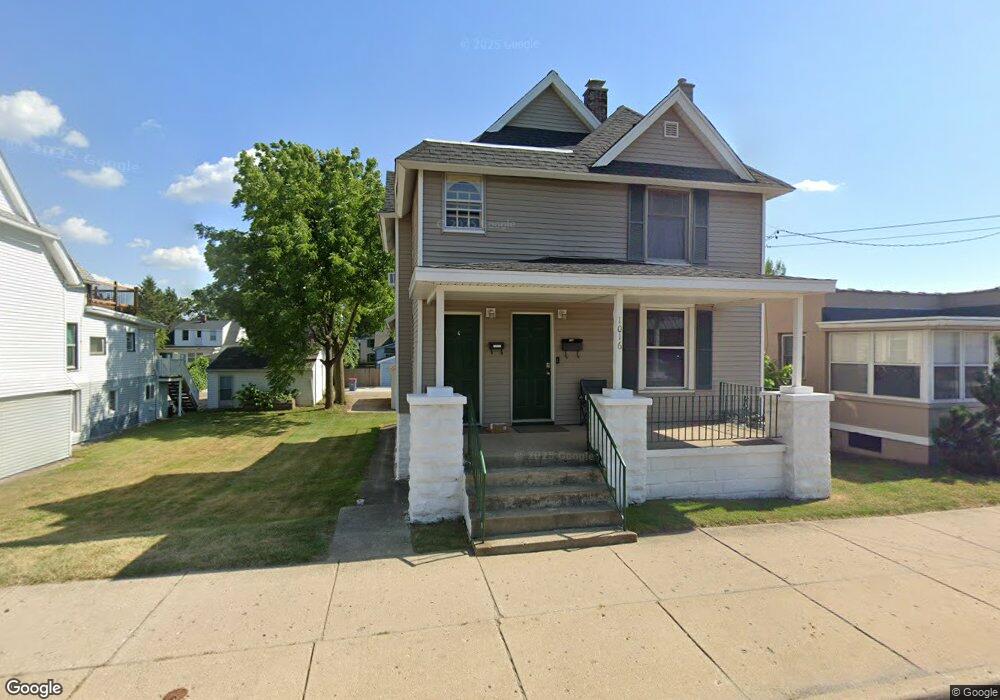
1016 Fulton St W Grand Rapids, MI 49504
SWAN NeighborhoodEstimated Value: $278,917 - $358,000
--
Bed
--
Bath
2,062
Sq Ft
$158/Sq Ft
Est. Value
About This Home
This home is located at 1016 Fulton St W, Grand Rapids, MI 49504 and is currently estimated at $326,729, approximately $158 per square foot. 1016 Fulton St W is a home located in Kent County with nearby schools including Shawmut Hills School, Westwood Middle School, and Union High School.
Ownership History
Date
Name
Owned For
Owner Type
Purchase Details
Closed on
Feb 3, 2014
Sold by
Lamancusa Donna and Nawara Michael C
Bought by
Ball Park Properties Llc
Current Estimated Value
Purchase Details
Closed on
Mar 31, 2006
Sold by
Nawara Frank S
Bought by
Lamancusa Donna and Nawara Michael C
Purchase Details
Closed on
Mar 27, 2006
Sold by
Ball Park Properties Llc
Bought by
Nawara Frank S
Purchase Details
Closed on
Oct 1, 2004
Sold by
Nawara Francis S and Nawara Michael C
Bought by
Ball Park Properties Llc
Purchase Details
Closed on
Feb 13, 2003
Sold by
Nawara Susan M
Bought by
Nawara Francis S
Purchase Details
Closed on
Dec 27, 2000
Sold by
Gaines Sharon
Bought by
Balzeski David A
Purchase Details
Closed on
Nov 7, 1997
Bought by
Gaines Sharon and Ball Park Properties Llc
Purchase Details
Closed on
Oct 31, 1997
Sold by
Cnnll Cnnll T T and Cnnll M
Bought by
Gns S and Ball Park Properties Llc
Purchase Details
Closed on
Sep 1, 1990
Sold by
Woroniecki Woroniecki G G and Woroniecki Connell
Bought by
Ball Park Properties Llc
Purchase Details
Closed on
Feb 5, 1988
Create a Home Valuation Report for This Property
The Home Valuation Report is an in-depth analysis detailing your home's value as well as a comparison with similar homes in the area
Home Values in the Area
Average Home Value in this Area
Purchase History
| Date | Buyer | Sale Price | Title Company |
|---|---|---|---|
| Ball Park Properties Llc | -- | None Available | |
| Lamancusa Donna | -- | None Available | |
| Nawara Frank S | -- | None Available | |
| Ball Park Properties Llc | -- | None Available | |
| Nawara Francis S | -- | -- | |
| Balzeski David A | -- | -- | |
| Balzeski D | -- | -- | |
| Gaines Sharon | $47,000 | -- | |
| Gns S | $47,000 | -- | |
| Ball Park Properties Llc | $38,500 | -- | |
| -- | $30,000 | -- |
Source: Public Records
Tax History Compared to Growth
Tax History
| Year | Tax Paid | Tax Assessment Tax Assessment Total Assessment is a certain percentage of the fair market value that is determined by local assessors to be the total taxable value of land and additions on the property. | Land | Improvement |
|---|---|---|---|---|
| 2025 | $2,275 | $154,300 | $0 | $0 |
| 2024 | $2,275 | $130,100 | $0 | $0 |
| 2023 | $2,257 | $116,400 | $0 | $0 |
| 2022 | $2,145 | $97,200 | $0 | $0 |
| 2021 | $2,090 | $86,500 | $0 | $0 |
| 2020 | $2,020 | $76,300 | $0 | $0 |
| 2019 | $2,068 | $60,500 | $0 | $0 |
| 2018 | $2,005 | $49,700 | $0 | $0 |
| 2017 | $1,956 | $41,800 | $0 | $0 |
| 2016 | $1,965 | $40,300 | $0 | $0 |
| 2015 | $2,060 | $40,300 | $0 | $0 |
| 2013 | -- | $35,100 | $0 | $0 |
Source: Public Records
Map
Nearby Homes
- 935 Watson St SW
- 914 Fulton St W
- 1017 Veto St NW
- 945 Veto St NW
- 1016 California St NW
- 1036 Park St SW
- 224 Lane Ave SW
- 210 Mardell Place SW
- 940 Lake Michigan Dr NW
- 842 California St NW
- 26 Valley Ave SW
- 934 Butterworth St SW
- 1209 California St NW
- 318 Hogadone Ave SW
- 335 Krakow Place SW
- 238 Richards Ave SW
- 1005 Jackson St NW Unit 1007
- 258 Richards Ave SW
- 1200 Jackson St NW
- 222 John Ball Park Dr SW
- 1020 Fulton St W
- 1010 Fulton St W
- 1017 Hovey St SW
- 1021 Hovey St SW
- 1013 Hovey St SW
- 1027 Hovey St SW
- 1009 Hovey St SW
- 1015 Fulton St W
- 1015 Fulton St W Unit 1019
- 1029 Hovey St SW
- 1005 Hovey St SW
- 1035 Hovey St SW
- 1001 Hovey St SW
- 1033 Fulton St W
- 1044 Fulton St W
- 1037 Hovey St SW
- 1041 Hovey St SW
- 1046 Fulton St W
- 1047 Hovey St SW
- 1050 Fulton St W