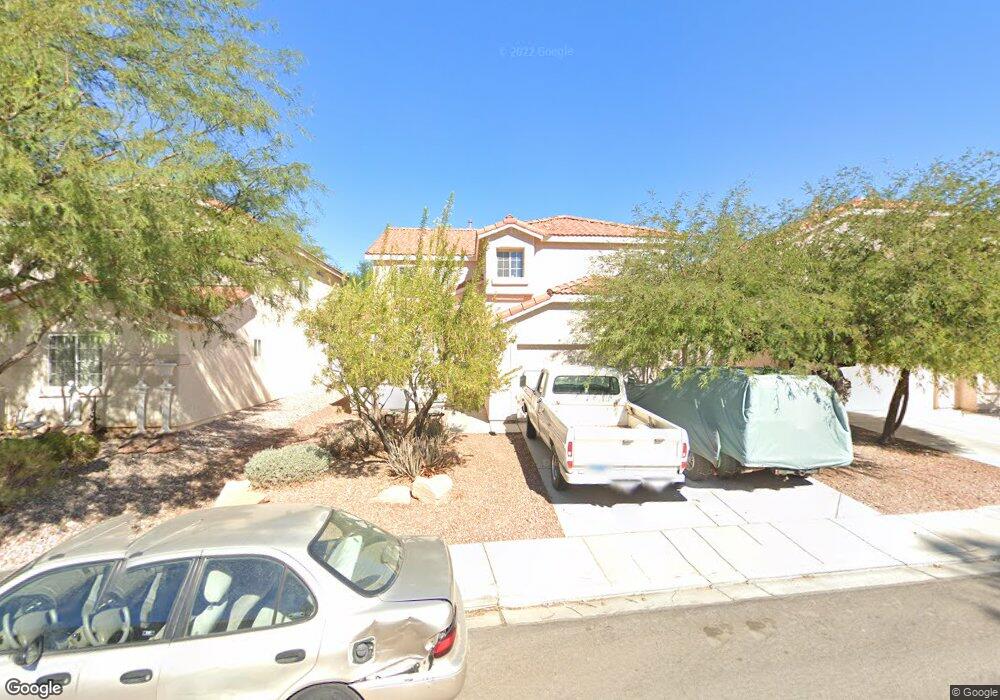
1016 Granite Ash Ave Unit 1 North Las Vegas, NV 89081
Northridge NeighborhoodEstimated Value: $418,000 - $450,000
4
Beds
3
Baths
2,171
Sq Ft
$199/Sq Ft
Est. Value
About This Home
This home is located at 1016 Granite Ash Ave Unit 1, North Las Vegas, NV 89081 and is currently estimated at $431,022, approximately $198 per square foot. 1016 Granite Ash Ave Unit 1 is a home located in Clark County with nearby schools including Jesse D. Scott Elementary School, Clifford O. Findlay Middle School, and Mojave High School.
Ownership History
Date
Name
Owned For
Owner Type
Purchase Details
Closed on
Jun 14, 2014
Sold by
Fitzpatrick Laura B
Bought by
Lollar Ronald H and Lollar Karen A
Current Estimated Value
Purchase Details
Closed on
Feb 11, 2011
Sold by
Wells Fargo Bank N A
Bought by
Lollar Ronald H and Lollar Karen A
Purchase Details
Closed on
Nov 18, 2010
Sold by
Mercado Eunice and Mercado Guadalupe
Bought by
Wells Fargo Bank N A
Purchase Details
Closed on
May 14, 2002
Sold by
D R Horton Inc
Bought by
Mercado Guadalupe and Mercado Eunice
Home Financials for this Owner
Home Financials are based on the most recent Mortgage that was taken out on this home.
Original Mortgage
$151,850
Interest Rate
7.13%
Create a Home Valuation Report for This Property
The Home Valuation Report is an in-depth analysis detailing your home's value as well as a comparison with similar homes in the area
Home Values in the Area
Average Home Value in this Area
Purchase History
| Date | Buyer | Sale Price | Title Company |
|---|---|---|---|
| Lollar Ronald H | $4,223 | None Available | |
| Lollar Ronald H | $114,000 | Fidelity Rainbow | |
| Lollar Ronald H | $114,000 | Fidelity Rainbow | |
| Wells Fargo Bank N A | $96,614 | Accommodation | |
| Mercado Guadalupe | $156,568 | United Title |
Source: Public Records
Mortgage History
| Date | Status | Borrower | Loan Amount |
|---|---|---|---|
| Previous Owner | Mercado Guadalupe | $151,850 |
Source: Public Records
Tax History Compared to Growth
Tax History
| Year | Tax Paid | Tax Assessment Tax Assessment Total Assessment is a certain percentage of the fair market value that is determined by local assessors to be the total taxable value of land and additions on the property. | Land | Improvement |
|---|---|---|---|---|
| 2025 | $1,583 | $112,590 | $30,800 | $81,790 |
| 2024 | $1,538 | $112,590 | $30,800 | $81,790 |
| 2023 | $1,538 | $106,800 | $29,400 | $77,400 |
| 2022 | $1,493 | $94,103 | $23,450 | $70,653 |
| 2021 | $1,450 | $88,695 | $21,700 | $66,995 |
| 2020 | $1,405 | $87,129 | $20,650 | $66,479 |
| 2019 | $1,387 | $82,161 | $16,800 | $65,361 |
| 2018 | $1,324 | $73,136 | $13,650 | $59,486 |
| 2017 | $2,104 | $62,717 | $12,600 | $50,117 |
| 2016 | $1,240 | $52,946 | $8,750 | $44,196 |
| 2015 | $1,237 | $47,867 | $8,050 | $39,817 |
| 2014 | $1,201 | $34,728 | $5,250 | $29,478 |
Source: Public Records
Map
Nearby Homes
- 1014 Edgestone Mark Ave
- 4848 Cutting Diamond Ct
- 1106 Granite Ash Ave
- 4935 Stormy Ridge St
- 4733 Cliff Breeze Dr
- 1014 Cliffbrook Hedge Ave
- 748 Stagecoach Ave
- 1022 Cliffbrook Hedge Ave Unit 3
- 5013 Drifting Pebble St
- 4714 Boulder Bay St
- 4824 Quartz Crest St
- 1014 Emerald Stone Ave
- 1106 Emerald Stone Ave
- 1405 Fantastic Ct
- 1413 Fantastic Ct
- 1512 Groom Ave
- 1214 Emerald Stone Ave
- 609 El Gusto Ave
- 4622 Rockpine Dr
- 4646 Gravel Rock St
- 1020 Granite Ash Ave
- 1012 Granite Ash Ave Unit 1
- 1008 Granite Ash Ave
- 1024 Granite Ash Ave Unit 1
- 1015 Pearl Marble Ave Unit 2
- 1019 Pearl Marble Ave
- 1004 Granite Ash Ave
- 1028 Granite Ash Ave
- 1023 Pearl Marble Ave
- 1017 Granite Ash Ave
- 1013 Granite Ash Ave Unit 1
- 1021 Granite Ash Ave
- 1102 Granite Ash Ave
- 924 Granite Ash Ave
- 1027 Pearl Marble Ave
- 1007 Pearl Marble Ave
- 1009 Granite Ash Ave
- 1025 Granite Ash Ave
- 1103 Pearl Marble Ave Unit 2
- 1005 Granite Ash Ave