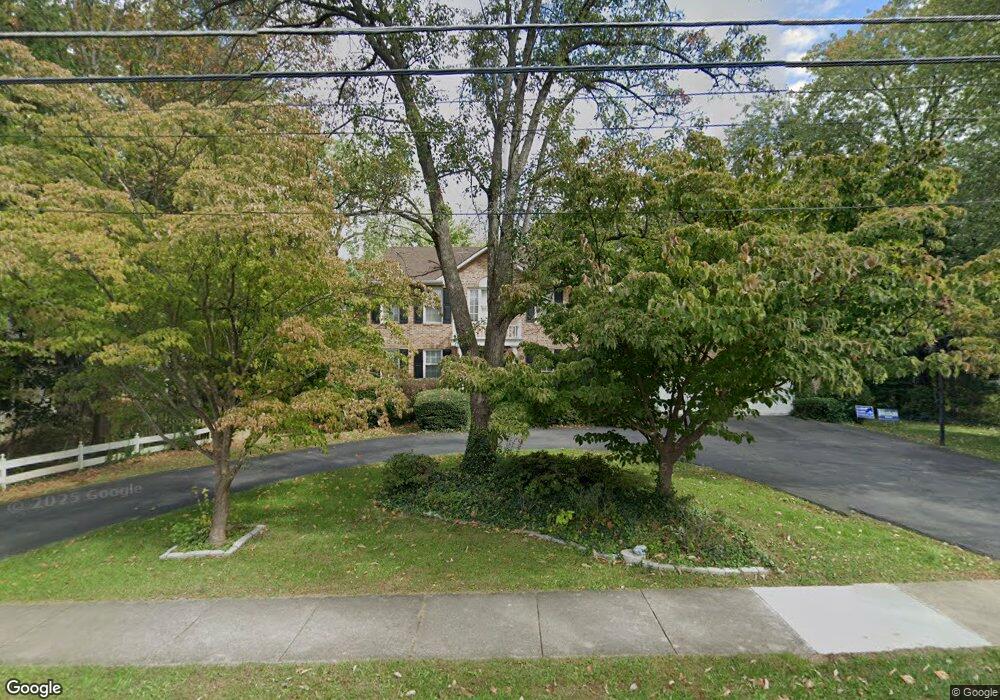
1016 Grant St Herndon, VA 20170
Estimated Value: $909,000 - $1,092,000
4
Beds
3
Baths
2,609
Sq Ft
$377/Sq Ft
Est. Value
About This Home
This home is located at 1016 Grant St, Herndon, VA 20170 and is currently estimated at $983,646, approximately $377 per square foot. 1016 Grant St is a home located in Fairfax County with nearby schools including Herndon Elementary, Herndon Middle School, and Herndon High School.
Ownership History
Date
Name
Owned For
Owner Type
Purchase Details
Closed on
Nov 15, 1996
Sold by
Samenfink Louis E and Samenfink Patricia M
Bought by
Reynolds Robert R and Reynolds Patricia A
Current Estimated Value
Home Financials for this Owner
Home Financials are based on the most recent Mortgage that was taken out on this home.
Original Mortgage
$192,500
Outstanding Balance
$18,804
Interest Rate
7.99%
Mortgage Type
New Conventional
Estimated Equity
$964,842
Create a Home Valuation Report for This Property
The Home Valuation Report is an in-depth analysis detailing your home's value as well as a comparison with similar homes in the area
Home Values in the Area
Average Home Value in this Area
Purchase History
| Date | Buyer | Sale Price | Title Company |
|---|---|---|---|
| Reynolds Robert R | $302,500 | -- |
Source: Public Records
Mortgage History
| Date | Status | Borrower | Loan Amount |
|---|---|---|---|
| Open | Reynolds Robert R | $192,500 |
Source: Public Records
Tax History
| Year | Tax Paid | Tax Assessment Tax Assessment Total Assessment is a certain percentage of the fair market value that is determined by local assessors to be the total taxable value of land and additions on the property. | Land | Improvement |
|---|---|---|---|---|
| 2025 | $11,516 | $842,910 | $315,000 | $527,910 |
| 2024 | $11,516 | $811,840 | $315,000 | $496,840 |
| 2023 | $11,413 | $821,980 | $315,000 | $506,980 |
| 2022 | $11,437 | $811,980 | $305,000 | $506,980 |
| 2021 | $7,868 | $670,480 | $248,000 | $422,480 |
| 2020 | $8,198 | $692,720 | $248,000 | $444,720 |
| 2019 | $7,492 | $633,000 | $225,000 | $408,000 |
| 2018 | $7,153 | $622,000 | $214,000 | $408,000 |
| 2017 | $6,791 | $584,910 | $200,000 | $384,910 |
| 2016 | $6,776 | $584,910 | $200,000 | $384,910 |
Source: Public Records
Map
Nearby Homes
- 865 Moffett Forge Rd
- 610 Worchester St
- 614 3rd St
- 22070 County Rd 254l Rd Unit Lots 23, 24, 25 & 26
- 1120 Stevenson Ct
- 815 Branch Dr Unit 207
- 645 Jefferson St
- 125 Fortnightly Blvd
- 120 Fortnightly Blvd
- 806 Grace St
- 1515 Judd Ct
- 1502 Kings Valley Ct
- 349 Reneau Way
- 567 Van Buren St
- 12524 Philmont Dr
- 12021 Walnut Branch Rd
- 12807 Scranton Ct
- 12815 Briery River Terrace
- 1543 Youngs Point Place
- 611 Center St Unit 104
Your Personal Tour Guide
Ask me questions while you tour the home.