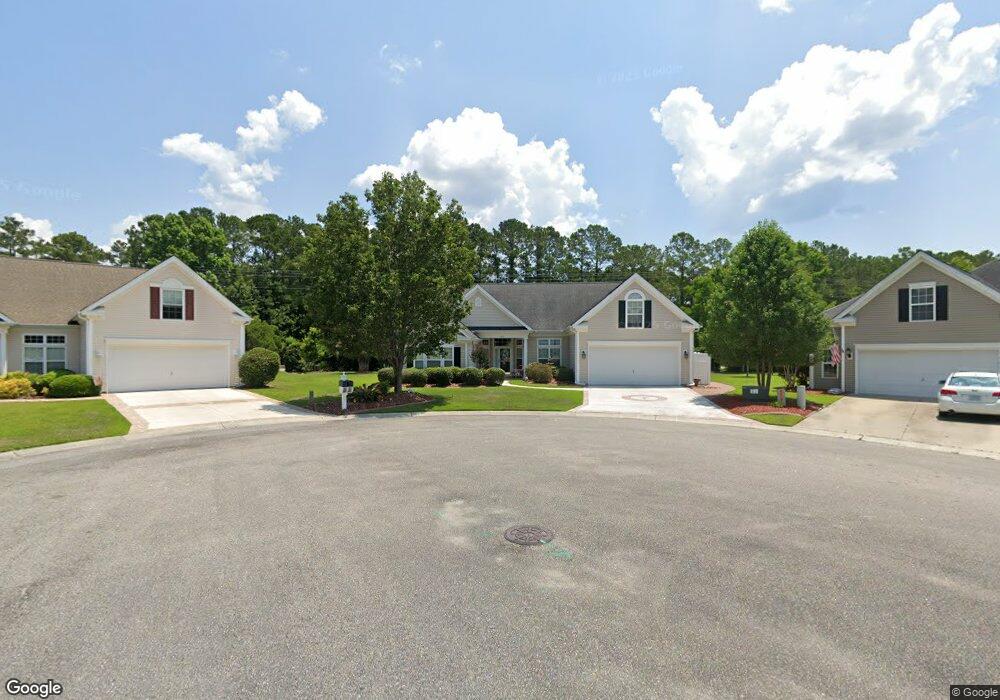
1016 Knightbridge Ct Murrells Inlet, SC 29576
Burgess NeighborhoodEstimated Value: $469,845 - $524,000
About This Home
This home is located at 1016 Knightbridge Ct, Murrells Inlet, SC 29576 and is currently estimated at $505,461, approximately $229 per square foot. 1016 Knightbridge Ct is a home located in Horry County with nearby schools including St. James Elementary School, St. James Intermediate, and St. James High School.
Ownership History
We collect this data history from publicly available records. To have your information removed, we recommend requesting removal directly through your county’s website.
Purchase Details
Purchase Details
Purchase Details
Home Financials for this Owner
Home Financials are based on the most recent Mortgage that was taken out on this home.Purchase Details
Purchase Details
Home Values in the Area
Average Home Value in this Area
Purchase History
We collect this data history from publicly available records. To have your information removed, we recommend requesting removal directly through your county’s website.
| Date | Buyer | Sale Price | Title Company |
|---|---|---|---|
| -- | -- | ||
| $275,000 | -- | ||
| $250,000 | -- | ||
| $239,553 | None Available | ||
| $39,000 | -- |
Mortgage History
We collect this data history from publicly available records. To have your information removed, we recommend requesting removal directly through your county’s website.
| Date | Status | Borrower | Loan Amount |
|---|---|---|---|
| Previous Owner | $237,500 |
Tax History
We collect this data history from publicly available records. To have your information removed, we recommend requesting removal directly through your county’s website.
| Year | Tax Paid | Tax Assessment Tax Assessment Total Assessment is a certain percentage of the fair market value that is determined by local assessors to be the total taxable value of land and additions on the property. | Land | Improvement |
|---|---|---|---|---|
| 2025 | $1,321 | $0 | $0 | $0 |
| 2024 | $1,321 | $17,623 | $5,444 | $12,179 |
| 2023 | $1,321 | $11,775 | $2,627 | $9,148 |
| 2021 | $1,015 | $11,775 | $2,627 | $9,148 |
| 2020 | $911 | $11,775 | $2,627 | $9,148 |
| 2019 | $911 | $11,775 | $2,627 | $9,148 |
| 2018 | $0 | $9,915 | $2,331 | $7,584 |
| 2017 | $682 | $9,915 | $2,331 | $7,584 |
| 2016 | -- | $9,915 | $2,331 | $7,584 |
| 2015 | $682 | $9,915 | $2,331 | $7,584 |
| 2014 | $736 | $9,915 | $2,331 | $7,584 |
Map
- 109 Wicklow Dr
- 0 Indigo Creek Blvd
- 9592 Indigo Creek Blvd
- 9619 Indigo Creek Blvd Unit on the Golf Course
- 113 Laurel Hill Place
- 223 Yellow Rail St
- 1218 Trent Dr
- 118 Ranch Haven Dr
- 11296 McDowell Shortcut Rd
- 402 Bumble Cir
- 9680 Indigo Creek Blvd
- 1420 Winged Foot Ct
- 9565 Indigo Club Dr
- 9563 Indigo Club Dr
- 1654 Sedgefield Dr
- 870 Castlebridge Dr
- 516 Ireland Way Unit 901
- 512 Ireland Way Unit 902
- 508 Ireland Way Unit 903
- 504 Ireland Way Unit 904
- 1016 Knightsbridge Ct
- 1012 Knightsbridge Ct
- 1020 Knightsbridge Ct
- 1008 Knightsbridge Ct
- 109 Knightsbridge Ct Unit C
- 1019 Knightsbridge Ct
- 1009 Knightsbridge Ct
- 1004 Knightsbridge Ct
- 100 Pickering Dr Unit Pebble Creek In Inte
- 100 Pickering Dr
- 1005 Knightsbridge Ct
- 104 Pickering Dr
- 108 Pickering Dr Unit International Club G
- 108 Pickering Dr
- 9589 Inverness Ln Unit INDIGO CREEK GOLF PL
- 1108 Worchester Ct
- 1112 Worchester Ct
- 114 Wicklow Dr Unit Pebble Creek
- 114 Wicklow Dr
- 104 Wicklow Dr
Ask me questions while you tour the home.