1016 N 1030 W Orem, UT 84057
Bonneville NeighborhoodEstimated Value: $456,022 - $477,000
3
Beds
3
Baths
1,624
Sq Ft
$286/Sq Ft
Est. Value
About This Home
This home is located at 1016 N 1030 W, Orem, UT 84057 and is currently estimated at $464,674, approximately $286 per square foot. 1016 N 1030 W is a home with nearby schools including Bonneville Elementary School, Orem Junior High School, and Timpanogos High School.
Ownership History
Date
Name
Owned For
Owner Type
Purchase Details
Closed on
Aug 3, 2021
Sold by
Mccann Daniel Marcus Reese and Mccann Jessica
Bought by
Mccann Investments Llc
Current Estimated Value
Purchase Details
Closed on
Jul 6, 2020
Sold by
Mccann Marc and Mccann Jessica
Bought by
Mccann Daniel Marcus Reese and Mccann Jessica
Home Financials for this Owner
Home Financials are based on the most recent Mortgage that was taken out on this home.
Original Mortgage
$239,000
Outstanding Balance
$211,929
Interest Rate
3.1%
Mortgage Type
New Conventional
Estimated Equity
$252,745
Purchase Details
Closed on
May 20, 2020
Sold by
Williamson Rentals Lc
Bought by
Mccann Marc and Mccann Jessica
Home Financials for this Owner
Home Financials are based on the most recent Mortgage that was taken out on this home.
Original Mortgage
$239,000
Outstanding Balance
$211,929
Interest Rate
3.1%
Mortgage Type
New Conventional
Estimated Equity
$252,745
Create a Home Valuation Report for This Property
The Home Valuation Report is an in-depth analysis detailing your home's value as well as a comparison with similar homes in the area
Home Values in the Area
Average Home Value in this Area
Purchase History
| Date | Buyer | Sale Price | Title Company |
|---|---|---|---|
| Mccann Investments Llc | -- | Provo Land Title Co | |
| Mccann Daniel Marcus Reese | -- | Provo Land Title Co | |
| Mccann Marc | -- | Provo Land Title Co |
Source: Public Records
Mortgage History
| Date | Status | Borrower | Loan Amount |
|---|---|---|---|
| Open | Mccann Daniel Marcus Reese | $239,000 | |
| Closed | Mccann Marc | $250,000 |
Source: Public Records
Tax History
| Year | Tax Paid | Tax Assessment Tax Assessment Total Assessment is a certain percentage of the fair market value that is determined by local assessors to be the total taxable value of land and additions on the property. | Land | Improvement |
|---|---|---|---|---|
| 2025 | $1,963 | $253,110 | -- | -- |
| 2024 | $1,963 | $240,020 | $0 | $0 |
| 2023 | $1,765 | $231,990 | $0 | $0 |
| 2022 | $1,974 | $251,295 | $0 | $0 |
| 2021 | $1,781 | $343,500 | $51,500 | $292,000 |
| 2020 | $1,625 | $308,000 | $46,200 | $261,800 |
| 2019 | $1,314 | $259,000 | $40,000 | $219,000 |
| 2018 | $1,375 | $259,000 | $40,000 | $219,000 |
| 2017 | $1,412 | $142,450 | $0 | $0 |
| 2016 | $1,531 | $142,450 | $0 | $0 |
| 2015 | $1,619 | $142,450 | $0 | $0 |
Source: Public Records
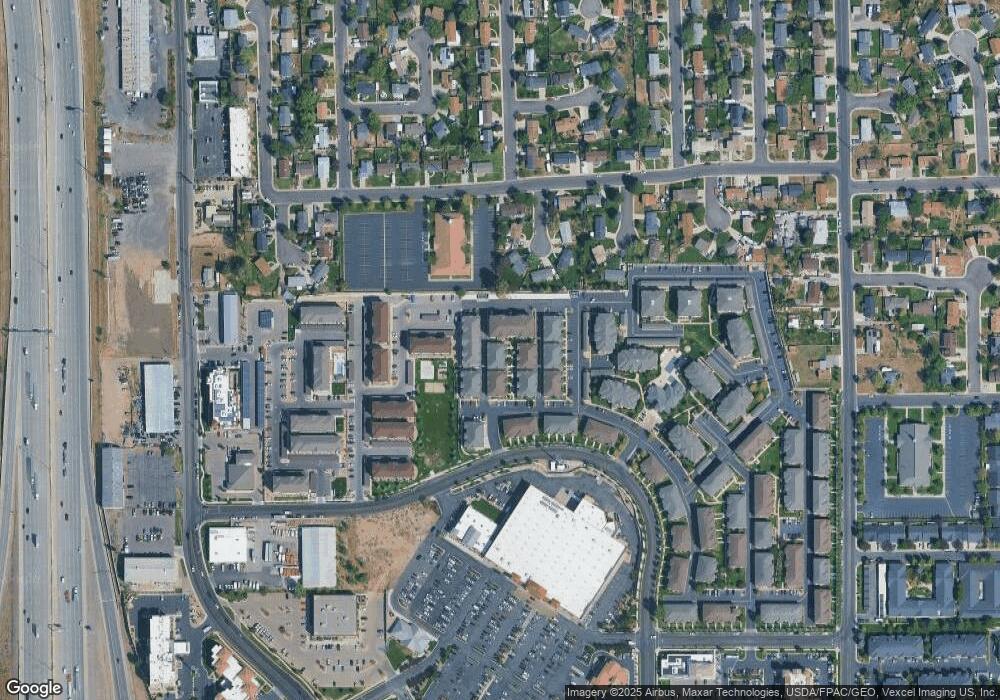
Map
Nearby Homes
- 1062 N 1035 W
- 999 W 1100 N
- 930 N 980 W
- 1069 N 1160 W
- 1140 W 950 N Unit D302
- 1140 W 950 N Unit D304
- 1140 W 950 N Unit A401
- 1123 N 800 W
- 954 W 630 N Unit 34,
- 686 N 835 W
- 1405 N 770 W
- 1058 W 570 St N
- 1535 N 950 W
- 1499 N 1200 W Unit 8
- 538 W 1120 N
- 1167 W 1550 N
- 545 W 1240 N
- 582 W 1300 N
- 875 W 530 N
- 803 W 530 N
Your Personal Tour Guide
Ask me questions while you tour the home.