Estimated Value: $119,500 - $148,000
--
Bed
1
Bath
1,257
Sq Ft
$107/Sq Ft
Est. Value
About This Home
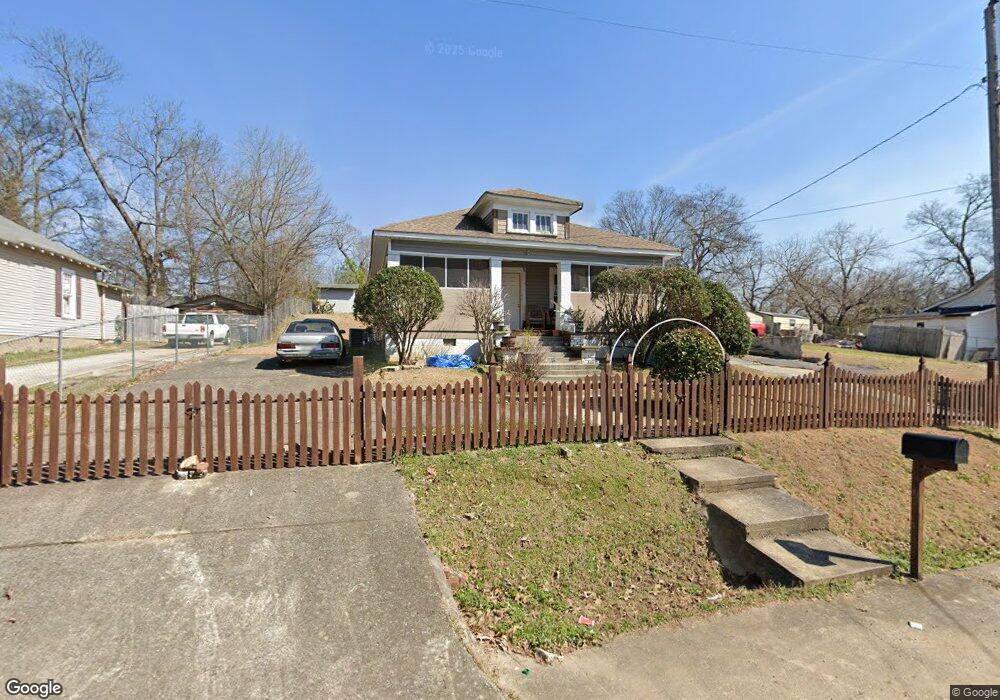
This home is located at 1016 N 2nd Ave NW, Rome, GA 30165 and is currently estimated at $134,125, approximately $106 per square foot. 1016 N 2nd Ave NW is a home located in Floyd County with nearby schools including Rome High School, St. Mary School, and Darlington School.
Ownership History
Date
Name
Owned For
Owner Type
Purchase Details
Closed on
Jul 22, 1997
Sold by
Bannister John T and Tonya Bannister
Bought by
Escutia Pedro A and Escutia K
Current Estimated Value
Purchase Details
Closed on
Jan 13, 1997
Sold by
Blanton Daniel C and Blanton Mary A
Bought by
Bannister John T and Tonya Bannister
Purchase Details
Closed on
Dec 30, 1983
Sold by
Youngblood E B
Bought by
Blanton Daniel C and Blanton Mary A
Purchase Details
Closed on
Oct 17, 1983
Sold by
F N B Of Rome
Bought by
Youngblood E B
Purchase Details
Closed on
Mar 3, 1982
Bought by
P and R
Purchase Details
Closed on
Aug 9, 1976
Sold by
Terry Charles E
Bought by
Green James
Purchase Details
Closed on
Feb 8, 1973
Sold by
Evans Lamar C
Bought by
Terry Charles E
Purchase Details
Closed on
Jan 9, 1973
Sold by
Brock Russell L
Bought by
Evans Lamar C
Purchase Details
Closed on
Jan 1, 1901
Bought by
Brock Russell L
Create a Home Valuation Report for This Property
The Home Valuation Report is an in-depth analysis detailing your home's value as well as a comparison with similar homes in the area
Home Values in the Area
Average Home Value in this Area
Purchase History
| Date | Buyer | Sale Price | Title Company |
|---|---|---|---|
| Escutia Pedro A | $43,300 | -- | |
| Bannister John T | $15,000 | -- | |
| Blanton Daniel C | $14,000 | -- | |
| Youngblood E B | $6,600 | -- | |
| P | -- | -- | |
| F N B Of Rome | $11,800 | -- | |
| Green James | -- | -- | |
| Terry Charles E | $11,500 | -- | |
| Evans Lamar C | $19,000 | -- | |
| Brock Russell L | -- | -- |
Source: Public Records
Tax History Compared to Growth
Tax History
| Year | Tax Paid | Tax Assessment Tax Assessment Total Assessment is a certain percentage of the fair market value that is determined by local assessors to be the total taxable value of land and additions on the property. | Land | Improvement |
|---|---|---|---|---|
| 2024 | $235 | $42,442 | $10,881 | $31,561 |
| 2023 | $232 | $34,490 | $9,672 | $24,818 |
| 2022 | $197 | $30,848 | $8,060 | $22,788 |
| 2021 | $201 | $25,497 | $8,060 | $17,437 |
| 2020 | $204 | $20,407 | $6,045 | $14,362 |
| 2019 | $201 | $19,533 | $6,045 | $13,488 |
| 2018 | $201 | $18,660 | $6,045 | $12,615 |
| 2017 | $201 | $18,127 | $6,045 | $12,082 |
| 2016 | $202 | $19,900 | $6,040 | $13,860 |
| 2015 | $178 | $19,548 | $6,040 | $13,508 |
| 2014 | $178 | $19,548 | $6,040 | $13,508 |
Source: Public Records
Map
Nearby Homes
- 1018 N 2nd Ave NW
- 1005 N 2nd Ave NW Unit 39
- PEARSON Plan at Shorter Village
- 0 Unbridled Rd Unit 22 23074684
- 6 Horseleg Creek Rd SW
- 527 W 11th St NE
- 4 Colonial Dr NW
- 601 W 10th St NE
- 204 Oakwood St NW
- 9 Shorter Cir SW
- 7 Raymond Ave NW
- 1006 Avenue A NE
- 209 Sherwood Rd SW
- 17 Rosewood Rd SW
- 14 Vineland Dr NW
- 19 Berckman Ln SW
- 3 Berckman Ln SW
- 101 Hardy Ave SW
- 14 Berckman Ln SW
- 1 E 3rd Ave Unit 302
- 1014 N 2nd Ave NW
- 1012 N 2nd Ave NW
- N N 2nd Ave NW
- 1020 N 2nd Ave NW
- 1010 N 2nd Ave NW
- 1124 N 2nd Ave NW
- 1008 N 2nd Ave NW
- 1101 Desoto Ave NW
- 1103 N 2nd Ave NW
- 101 Duncan St NW
- 1021 Desoto Ave NW
- 1105 N 2nd Ave NW
- 1013 Desoto Ave NW
- 218 Iron St NW
- 218 Iron St NW
- 1107 N 2nd Ave NW
- 211A Barron Rd NE
- 0 Desoto Ave NW Unit 7509705
- 0 Desoto Ave NW Unit 7033111
- 0 Desoto Ave NW Unit 8244559