1016 N C St Duncan, OK 73533
Estimated Value: $57,000 - $108,116
3
Beds
1
Bath
1,250
Sq Ft
$62/Sq Ft
Est. Value
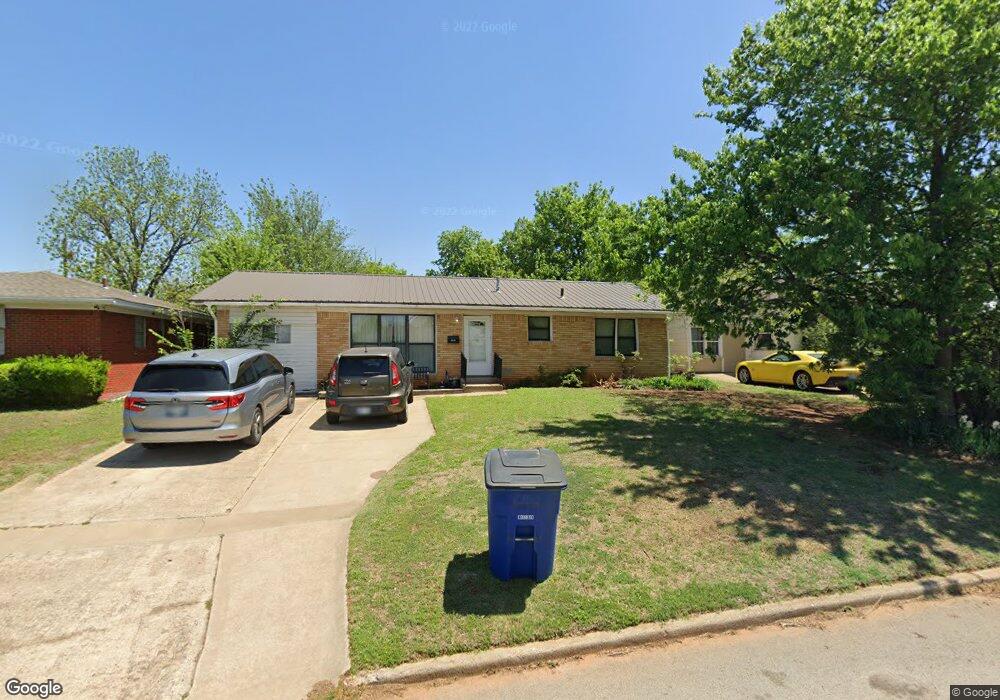
About This Home
This home is located at 1016 N C St, Duncan, OK 73533 and is currently estimated at $77,529, approximately $62 per square foot. 1016 N C St is a home located in Stephens County with nearby schools including Woodrow Wilson Elementary School, Duncan Middle School, and Duncan High School.
Ownership History
Date
Name
Owned For
Owner Type
Purchase Details
Closed on
Apr 11, 2016
Sold by
Honoroff Ellebn Louise and Honoroff Ellen L
Bought by
Norton Patrick and Norton Mary
Current Estimated Value
Purchase Details
Closed on
Jun 10, 2005
Sold by
Thomas James R and Thomas Dorothy M
Bought by
Dean Linda M
Home Financials for this Owner
Home Financials are based on the most recent Mortgage that was taken out on this home.
Original Mortgage
$50,400
Interest Rate
8.62%
Mortgage Type
Assumption
Purchase Details
Closed on
Feb 28, 2003
Sold by
Bridges Katharine R
Purchase Details
Closed on
Jun 1, 1999
Sold by
Bridges William P
Create a Home Valuation Report for This Property
The Home Valuation Report is an in-depth analysis detailing your home's value as well as a comparison with similar homes in the area
Home Values in the Area
Average Home Value in this Area
Purchase History
| Date | Buyer | Sale Price | Title Company |
|---|---|---|---|
| Norton Patrick | $20,000 | None Available | |
| Dean Linda M | $56,000 | Ward Title & Closing Company | |
| -- | $23,500 | -- | |
| -- | -- | -- |
Source: Public Records
Mortgage History
| Date | Status | Borrower | Loan Amount |
|---|---|---|---|
| Previous Owner | Dean Linda M | $50,400 |
Source: Public Records
Tax History Compared to Growth
Tax History
| Year | Tax Paid | Tax Assessment Tax Assessment Total Assessment is a certain percentage of the fair market value that is determined by local assessors to be the total taxable value of land and additions on the property. | Land | Improvement |
|---|---|---|---|---|
| 2024 | $272 | $3,197 | $406 | $2,791 |
| 2023 | $272 | $3,197 | $406 | $2,791 |
| 2022 | $247 | $3,045 | $406 | $2,639 |
| 2021 | $246 | $2,900 | $406 | $2,494 |
| 2020 | $227 | $2,630 | $406 | $2,224 |
| 2019 | $217 | $2,505 | $406 | $2,099 |
| 2018 | $212 | $2,505 | $406 | $2,099 |
| 2017 | $195 | $2,272 | $406 | $1,866 |
| 2016 | $349 | $4,110 | $406 | $3,704 |
| 2015 | $306 | $4,045 | $406 | $3,639 |
| 2014 | $306 | $3,853 | $406 | $3,447 |
Source: Public Records
Map
Nearby Homes
- 203 E Spruce Ave
- 101 101 W Hackberry Ave
- 100 100 Forest Hills Dr
- 1261 1261 Cotten Hills Dr
- 703 703 N C
- 1213 Avalon Ave
- 618 618 N G St
- 1229 Avalon Ave
- 206 E Pine Ave
- 513 513 N B St
- 607 607 N I
- 606 606 N I St
- 417 417 N C
- 606 N J St
- 1112 N 5th St
- 406 St
- 413 413 N 1st St
- 510 510 N K St
- 320 N C St
- 322 322 N D St