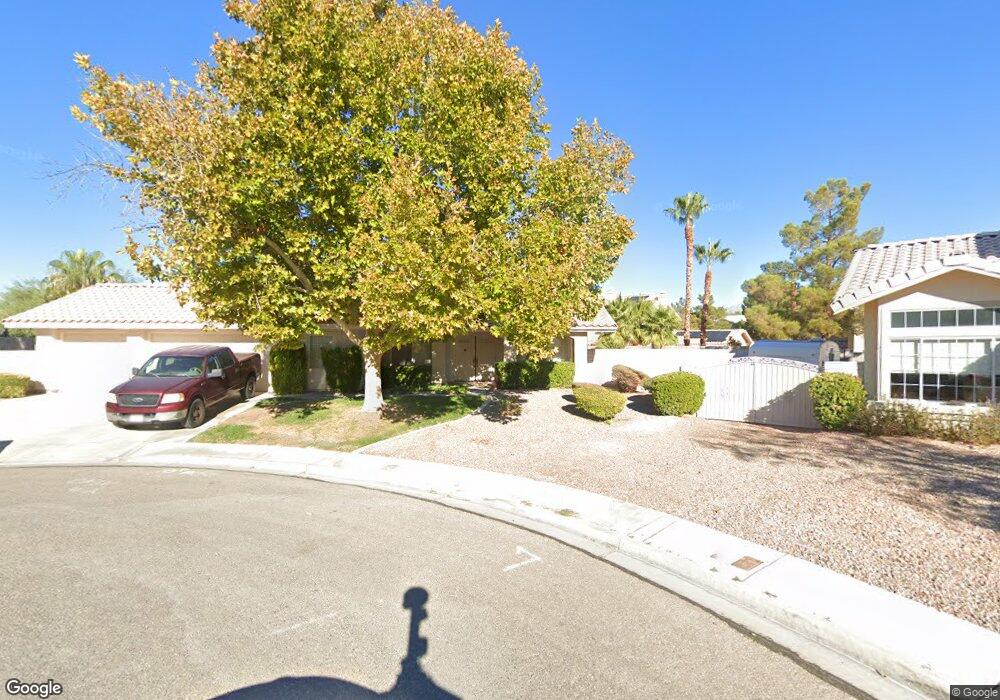
1016 Sage Hollow Cir North Las Vegas, NV 89031
Craig Ranch NeighborhoodEstimated Value: $505,000 - $580,000
3
Beds
2
Baths
1,915
Sq Ft
$277/Sq Ft
Est. Value
About This Home
This home is located at 1016 Sage Hollow Cir, North Las Vegas, NV 89031 and is currently estimated at $530,757, approximately $277 per square foot. 1016 Sage Hollow Cir is a home located in Clark County with nearby schools including Lee Antonello Elementary School, Brian & Teri Cram Middle School, and Legacy High School.
Ownership History
Date
Name
Owned For
Owner Type
Purchase Details
Closed on
Jan 22, 2013
Sold by
Kavanugh Ruth E
Bought by
Kavanaugh Ruth E
Current Estimated Value
Purchase Details
Closed on
May 25, 2002
Sold by
Kavanaugh Ruth E
Bought by
Kavanaugh Ruth E and The Ruth E Kavanaugh 1996 Revocable Livi
Home Financials for this Owner
Home Financials are based on the most recent Mortgage that was taken out on this home.
Original Mortgage
$22,500
Interest Rate
6.89%
Mortgage Type
Credit Line Revolving
Purchase Details
Closed on
Jan 5, 2001
Sold by
Kavanaugh Ruth E
Bought by
Kavanaugh E and Ruth E Kavanaugh 1996 Revocable Living T
Purchase Details
Closed on
Jan 25, 1999
Sold by
Kavanaugh Ruth E
Bought by
Kavanaugh Ruth E
Home Financials for this Owner
Home Financials are based on the most recent Mortgage that was taken out on this home.
Original Mortgage
$133,350
Interest Rate
6.63%
Purchase Details
Closed on
May 8, 1996
Sold by
Kavanaugh Ruth E
Bought by
Kavanaugh Ruth E
Create a Home Valuation Report for This Property
The Home Valuation Report is an in-depth analysis detailing your home's value as well as a comparison with similar homes in the area
Home Values in the Area
Average Home Value in this Area
Purchase History
| Date | Buyer | Sale Price | Title Company |
|---|---|---|---|
| Kavanaugh Ruth E | -- | None Available | |
| Kavanaugh Ruth E | -- | First American Title Co | |
| Kavanaugh E | -- | -- | |
| Kavanaugh Ruth E | -- | Nevada Title Company | |
| Kavanaugh Ruth E | -- | -- |
Source: Public Records
Mortgage History
| Date | Status | Borrower | Loan Amount |
|---|---|---|---|
| Closed | Kavanaugh Ruth E | $22,500 | |
| Closed | Kavanaugh Ruth E | $133,350 |
Source: Public Records
Tax History Compared to Growth
Tax History
| Year | Tax Paid | Tax Assessment Tax Assessment Total Assessment is a certain percentage of the fair market value that is determined by local assessors to be the total taxable value of land and additions on the property. | Land | Improvement |
|---|---|---|---|---|
| 2025 | $2,469 | $125,059 | $39,900 | $85,159 |
| 2024 | $3,448 | $125,059 | $39,900 | $85,159 |
| 2023 | $3,448 | $120,156 | $39,200 | $80,956 |
| 2022 | $2,328 | $107,746 | $32,900 | $74,846 |
| 2021 | $2,260 | $103,868 | $32,550 | $71,318 |
| 2020 | $2,191 | $97,918 | $26,950 | $70,968 |
| 2019 | $2,127 | $96,732 | $26,600 | $70,132 |
| 2018 | $2,065 | $89,477 | $21,350 | $68,127 |
| 2017 | $2,745 | $81,836 | $20,650 | $61,186 |
| 2016 | $1,956 | $82,562 | $16,450 | $66,112 |
| 2015 | $1,952 | $63,552 | $12,250 | $51,302 |
| 2014 | -- | $54,706 | $12,250 | $42,456 |
Source: Public Records
Map
Nearby Homes
- 5912 Hollowridge Rd
- 901 Sage Hollow Cir
- 1009 Nawkee Dr
- 5808 Lone Song Rd
- 1003 Dover Glen Dr
- 920 Grey Hollow Ave
- 5829 Forest Creek Rd
- 825 Cornerstone Place
- 6136 Benchmark Way
- 1323 Borderwood Ln
- 629 Blossom Berry Ct
- 635 Dry Valley Ave
- 5717 Wizard Wand St
- 1515 Fort Dix Cir
- 625 Bright Lights Ave
- 623 Dry Valley Ave
- 721 W Azure Ave
- 5871 Prairie Ridge Cir
- 717 W Azure Ave Unit 3
- 5625 Clay Ridge Rd
- 5916 Hollowridge Rd
- 1008 Sage Hollow Cir
- 1017 Whitehollow Ave
- 1009 Whitehollow Ave
- 1017 Sage Hollow Cir
- 1025 Whitehollow Ave
- 1000 Sage Hollow Cir
- 1001 Whitehollow Ave
- 1001 Sage Hollow Cir
- 1018 Indian Hollow Ave
- 1018 Whitehollow Ave
- 1010 Indian Hollow Ave
- 1026 Indian Hollow Ave
- 1010 Whitehollow Ave
- 926 Sage Hollow Cir
- 925 Whitehollow Ave
- 1026 Whitehollow Ave
- 1002 Whitehollow Ave
- 1002 Indian Hollow Ave