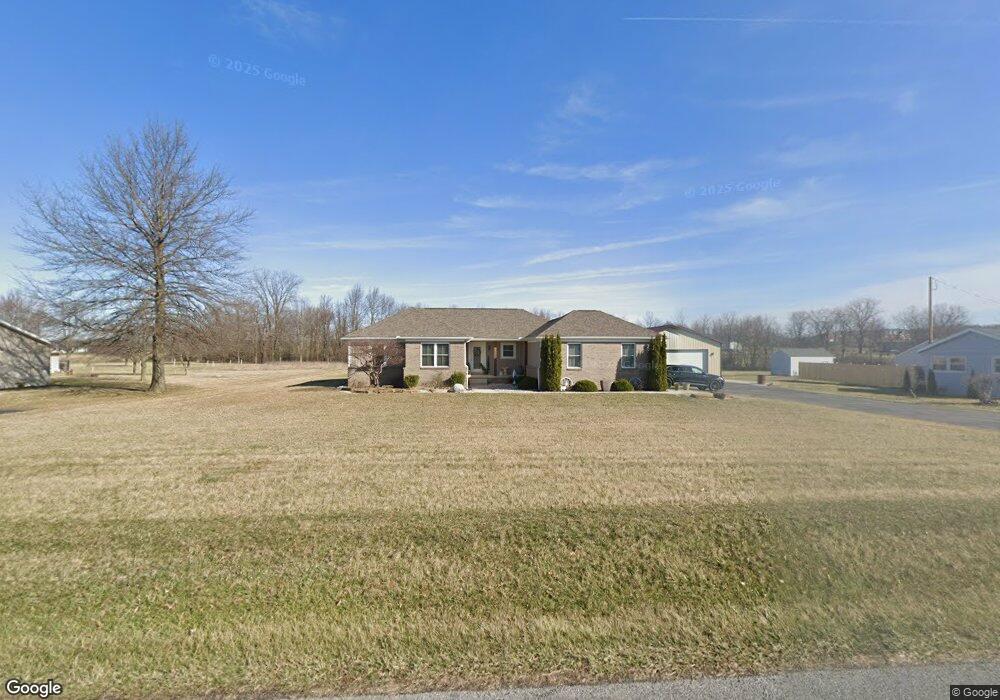
10160 Township Road 94 Findlay, OH 45840
Estimated Value: $399,000 - $840,000
3
Beds
3
Baths
1,878
Sq Ft
$293/Sq Ft
Est. Value
About This Home
This home is located at 10160 Township Road 94, Findlay, OH 45840 and is currently estimated at $550,428, approximately $293 per square foot. 10160 Township Road 94 is a home with nearby schools including Liberty-Benton Elementary School, Liberty-Benton Middle School, and Liberty-Benton High School.
Ownership History
Date
Name
Owned For
Owner Type
Purchase Details
Closed on
Mar 29, 2021
Sold by
Estate Of Daniel J Troxel
Bought by
Troxel Julie A
Current Estimated Value
Purchase Details
Closed on
Sep 27, 2016
Bought by
Daniel J Troxel
Home Financials for this Owner
Home Financials are based on the most recent Mortgage that was taken out on this home.
Interest Rate
3.48%
Purchase Details
Closed on
Jun 27, 2016
Sold by
Phegley David E and Phegley Carol J
Bought by
Sutherland Michael S and Sutherland Kelly R
Home Financials for this Owner
Home Financials are based on the most recent Mortgage that was taken out on this home.
Original Mortgage
$15,000
Interest Rate
3.58%
Mortgage Type
Future Advance Clause Open End Mortgage
Purchase Details
Closed on
Oct 11, 2006
Sold by
Frech Amos E and Frech Ruth Ellen
Bought by
Phegley David E and Phegley Carol J
Purchase Details
Closed on
May 10, 1991
Bought by
Frech Amos E and Ruth Ellen
Create a Home Valuation Report for This Property
The Home Valuation Report is an in-depth analysis detailing your home's value as well as a comparison with similar homes in the area
Home Values in the Area
Average Home Value in this Area
Purchase History
| Date | Buyer | Sale Price | Title Company |
|---|---|---|---|
| Troxel Julie A | -- | None Available | |
| Daniel J Troxel | $36,000 | -- | |
| Sutherland Michael S | $35,000 | None Available | |
| Phegley David E | $30,000 | None Available | |
| Frech Amos E | -- | -- |
Source: Public Records
Mortgage History
| Date | Status | Borrower | Loan Amount |
|---|---|---|---|
| Previous Owner | Daniel J Troxel | -- | |
| Previous Owner | Sutherland Michael S | $15,000 |
Source: Public Records
Tax History Compared to Growth
Tax History
| Year | Tax Paid | Tax Assessment Tax Assessment Total Assessment is a certain percentage of the fair market value that is determined by local assessors to be the total taxable value of land and additions on the property. | Land | Improvement |
|---|---|---|---|---|
| 2024 | $4,757 | $127,880 | $10,640 | $117,240 |
| 2023 | $4,645 | $127,880 | $10,640 | $117,240 |
| 2022 | $4,600 | $127,880 | $10,640 | $117,240 |
| 2021 | $4,038 | $99,090 | $9,380 | $89,710 |
| 2020 | $3,713 | $99,090 | $9,380 | $89,710 |
| 2019 | $3,562 | $99,090 | $9,380 | $89,710 |
| 2018 | $2,889 | $89,620 | $7,820 | $81,800 |
| 2017 | $955 | $50,550 | $7,820 | $42,730 |
| 2016 | $110 | $2,510 | $2,510 | $0 |
| 2015 | $95 | $2,510 | $2,510 | $0 |
| 2014 | $95 | $2,510 | $2,510 | $0 |
| 2012 | $102 | $2,510 | $2,510 | $0 |
Source: Public Records
Map
Nearby Homes
- 0 County Road 140
- 6535 Silver Lake Dr
- 0 County Road 95 Unit 6097574
- 9960 W Us Route 224
- 0 County Road 223
- 1405 Cypress Lake
- 3106 Saddlebrook
- 925 W Melrose Ave
- 933 Laurel Ln
- 3018 Gleneagle Dr
- 905 W Melrose Ave
- 8179 Hazelwood Dr
- 1310 Muirfield Dr
- 643 Edith Ave
- 636 W Melrose Ave
- 8922 Township Road 94
- 8256 Silverwood Dr
- 0 Rock Candy Rd Unit Lot 159
- 0 Rock Candy Rd Unit Lot 170
- 0 Rock Candy Rd Unit Lot 172 206819
- 10186 Township Road 94
- 10186 Township Road 94
- 10140 Township Road 94
- 10200 Township Road 94
- 10245 Township Road 94
- 10078 Township Road 94
- 10272 Township Road 94
- 10036 Township Road 94
- 6951 County Road 140
- 10257 Township Road 94
- 6927 County Road 140
- 10280 Township Road 94
- 6979 County Road 140
- 10269 Township Road 94
- 10013 Township Road 94
- 6919 County Road 140
- 6986 County Road 140
- 6895 County Road 140
- 6956 County Road 140
- 10295 Township Road 94