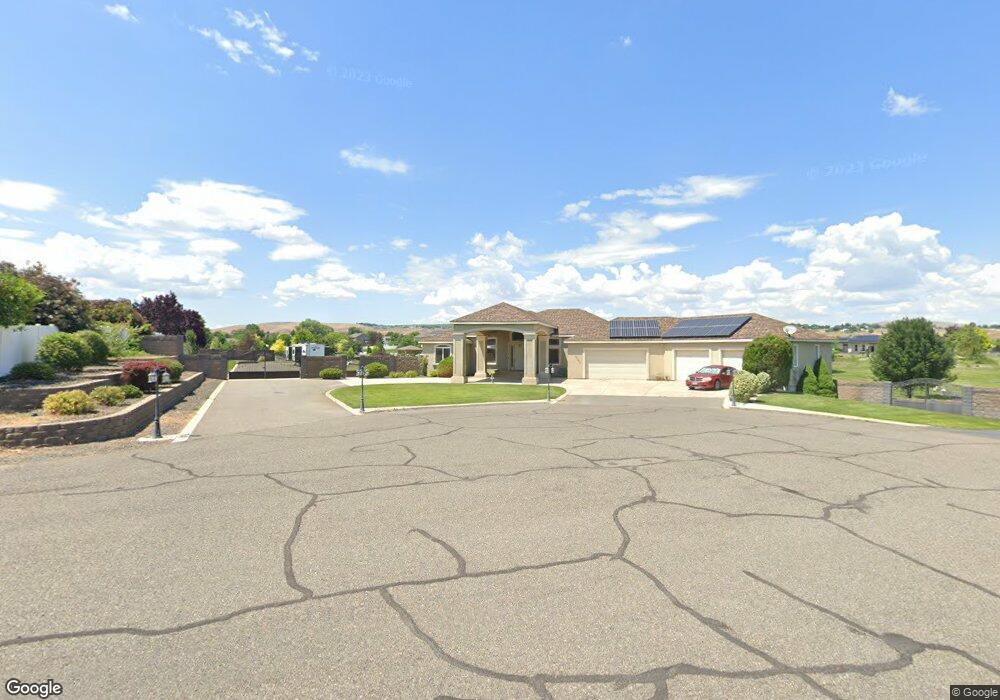
101604 E Ridgeview Ct Unit Lock Box On Back Doo Kennewick, WA 99338
Estimated Value: $907,000 - $1,139,956
6
Beds
3
Baths
2,614
Sq Ft
$383/Sq Ft
Est. Value
About This Home
This home is located at 101604 E Ridgeview Ct Unit Lock Box On Back Doo, Kennewick, WA 99338 and is currently estimated at $1,000,489, approximately $382 per square foot. 101604 E Ridgeview Ct Unit Lock Box On Back Doo is a home located in Benton County with nearby schools including Cottonwood Elementary School, Desert Hills Middle School, and Kamiakin High School.
Ownership History
Date
Name
Owned For
Owner Type
Purchase Details
Closed on
Nov 11, 2015
Sold by
The Bank Of New York Mellon
Bought by
Simmons Edward and Simmons Dilia
Current Estimated Value
Home Financials for this Owner
Home Financials are based on the most recent Mortgage that was taken out on this home.
Original Mortgage
$336,000
Outstanding Balance
$265,797
Interest Rate
3.96%
Mortgage Type
New Conventional
Estimated Equity
$734,692
Purchase Details
Closed on
Apr 3, 2015
Sold by
Dempsey Sonya and Dempsey Justin
Bought by
The Bank Of New York Mellon and The Bank Of New York
Purchase Details
Closed on
Jun 13, 2006
Sold by
Don Pratt Construction Inc
Bought by
Dempsey Justin and Dempsey Sonya
Home Financials for this Owner
Home Financials are based on the most recent Mortgage that was taken out on this home.
Original Mortgage
$480,797
Interest Rate
7.99%
Mortgage Type
Fannie Mae Freddie Mac
Create a Home Valuation Report for This Property
The Home Valuation Report is an in-depth analysis detailing your home's value as well as a comparison with similar homes in the area
Home Values in the Area
Average Home Value in this Area
Purchase History
| Date | Buyer | Sale Price | Title Company |
|---|---|---|---|
| Simmons Edward | $361,011 | Chicago Title | |
| The Bank Of New York Mellon | $510,000 | Accommodation | |
| Dempsey Justin | $459,188 | Chicago Title |
Source: Public Records
Mortgage History
| Date | Status | Borrower | Loan Amount |
|---|---|---|---|
| Open | Simmons Edward | $336,000 | |
| Previous Owner | Dempsey Justin | $480,797 |
Source: Public Records
Tax History Compared to Growth
Tax History
| Year | Tax Paid | Tax Assessment Tax Assessment Total Assessment is a certain percentage of the fair market value that is determined by local assessors to be the total taxable value of land and additions on the property. | Land | Improvement |
|---|---|---|---|---|
| 2024 | $8,595 | $959,420 | $187,200 | $772,220 |
| 2023 | $8,595 | $959,420 | $187,200 | $772,220 |
| 2022 | $8,284 | $851,840 | $74,580 | $777,260 |
| 2021 | $7,484 | $763,010 | $74,580 | $688,430 |
| 2020 | $7,527 | $674,180 | $74,580 | $599,600 |
| 2019 | $7,042 | $651,980 | $74,580 | $577,400 |
| 2018 | $6,978 | $629,770 | $74,580 | $555,190 |
| 2017 | $6,511 | $518,730 | $74,580 | $444,150 |
| 2016 | $6,600 | $522,390 | $70,000 | $452,390 |
| 2015 | $6,663 | $522,390 | $70,000 | $452,390 |
| 2014 | -- | $522,390 | $70,000 | $452,390 |
| 2013 | -- | $522,390 | $70,000 | $452,390 |
Source: Public Records
Map
Nearby Homes
- 101607 E Ridgeview Ct
- 98801 E Brandon Dr
- 6115 W 32nd Ave
- 6824 W 27th Ave
- 22803 Cottonwood Springs Blvd
- 100024 Canyon View Dr
- 104105 E Badger Rd
- 102909 E 1023 Prairie SE
- 26305 S 1005 Prairie SE
- 14002 Abigail Place Unit Lot 8
- 25911 S 1005 Prairie SE
- 14338 Abigail Place Unit Lot11
- 14442 Abigail Place Unit Lot12
- 104118 E Addison Ave
- 27907 S 959 Prairie SE
- 105032 Addison Ave
- 14653 Abigail Place Unit Lot 2
- 105247 E Tatum Blvd
- 27509 S 932 Prairie SE
- 27866 Mammoth Dr
- 101604 E Ridgeview Ct
- 101604 E Ridgeview Ct
- 101503 E Ridgeview Ct
- 101402 E Ridgeview Ct
- 100604 Hillview Dr
- 101405 E Ridgeview Ct
- 100302 Hillview Dr
- 100821 E Brandon Dr
- 100617 E Brandon Dr
- 100315 E Brandon Dr
- 100104 Hillview Dr
- 100603 Hillview Dr
- 100902 E Ridgeview Dr
- 101301 E Ridgeview Dr
- 21009 Cottonwood Dr
- 99811 E Brandon Dr
- 99802 Hillview Dr
- 101203 E Ridgeview Dr
- NKA 984 Prse
- NKA 89pr