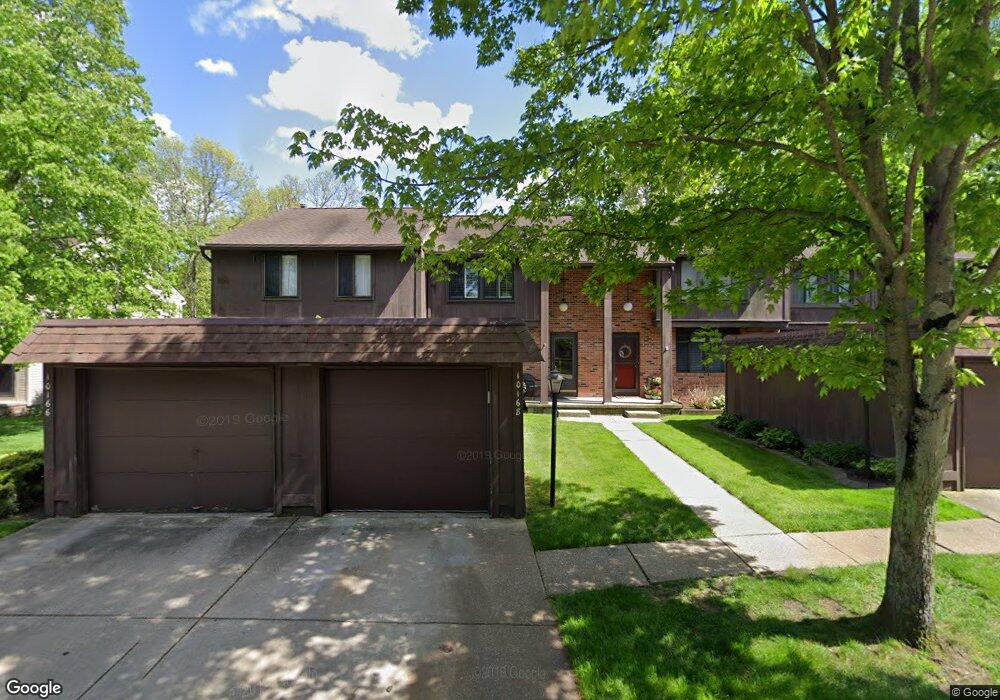
10168 Spinnaker Run Unit 1 Aurora, OH 44202
Estimated Value: $166,303 - $204,000
3
Beds
2
Baths
1,148
Sq Ft
$161/Sq Ft
Est. Value
About This Home
This home is located at 10168 Spinnaker Run Unit 1, Aurora, OH 44202 and is currently estimated at $184,576, approximately $160 per square foot. 10168 Spinnaker Run Unit 1 is a home located in Summit County with nearby schools including Wilcox Primary School, Samuel Bissell Elementary School, and Dodge Intermediate School.
Ownership History
Date
Name
Owned For
Owner Type
Purchase Details
Closed on
May 13, 2016
Sold by
Zahler Michelle and Zahler Frank A
Bought by
Curry Gabriel K
Current Estimated Value
Home Financials for this Owner
Home Financials are based on the most recent Mortgage that was taken out on this home.
Original Mortgage
$68,000
Outstanding Balance
$54,221
Interest Rate
3.71%
Mortgage Type
New Conventional
Estimated Equity
$130,355
Purchase Details
Closed on
Jun 25, 2008
Sold by
Litrun Jamie C
Bought by
Robinson Michelle
Home Financials for this Owner
Home Financials are based on the most recent Mortgage that was taken out on this home.
Original Mortgage
$89,600
Interest Rate
6.05%
Mortgage Type
Purchase Money Mortgage
Purchase Details
Closed on
Jun 12, 2001
Sold by
Callam James A
Bought by
Litrun Jamie C
Home Financials for this Owner
Home Financials are based on the most recent Mortgage that was taken out on this home.
Original Mortgage
$77,200
Interest Rate
7.16%
Create a Home Valuation Report for This Property
The Home Valuation Report is an in-depth analysis detailing your home's value as well as a comparison with similar homes in the area
Home Values in the Area
Average Home Value in this Area
Purchase History
| Date | Buyer | Sale Price | Title Company |
|---|---|---|---|
| Curry Gabriel K | $85,000 | Chicago Title | |
| Robinson Michelle | $112,000 | Multiple | |
| Litrun Jamie C | $96,500 | First Class Title Agency Inc |
Source: Public Records
Mortgage History
| Date | Status | Borrower | Loan Amount |
|---|---|---|---|
| Open | Curry Gabriel K | $68,000 | |
| Previous Owner | Robinson Michelle | $89,600 | |
| Previous Owner | Litrun Jamie C | $77,200 | |
| Closed | Litrun Jamie C | $9,640 |
Source: Public Records
Tax History
| Year | Tax Paid | Tax Assessment Tax Assessment Total Assessment is a certain percentage of the fair market value that is determined by local assessors to be the total taxable value of land and additions on the property. | Land | Improvement |
|---|---|---|---|---|
| 2024 | $2,684 | $46,159 | $5,562 | $40,597 |
| 2023 | $2,684 | $46,159 | $5,562 | $40,597 |
| 2022 | $2,294 | $34,532 | $4,120 | $30,412 |
| 2021 | $2,303 | $34,532 | $4,120 | $30,412 |
| 2020 | $2,327 | $34,530 | $4,120 | $30,410 |
| 2019 | $2,029 | $24,940 | $3,710 | $21,230 |
| 2018 | $1,860 | $24,940 | $3,710 | $21,230 |
| 2017 | $1,942 | $24,940 | $3,710 | $21,230 |
| 2016 | $1,619 | $27,990 | $4,120 | $23,870 |
| 2015 | $1,942 | $27,990 | $4,120 | $23,870 |
| 2014 | $1,938 | $27,990 | $4,120 | $23,870 |
| 2013 | $2,079 | $30,510 | $4,120 | $26,390 |
Source: Public Records
Map
Nearby Homes
- 10265 Beaver Trail
- 3659 Shady Timber Dr
- 10137 Tradewinds Cove
- 3624 Nautilus Trail
- 3564 Shady Timber Dr
- 3660 Ivy Ct
- 3645 Firethorn Dr
- 10564 Herrington Dr
- 3784 Firethorn Dr
- 10400 Maryland St
- 10453 Dogwood Dr
- 3082 Willowbrook Dr
- 9864 Burton Dr
- 1177 Moneta Ave
- 1060 Bryce Ave
- 1101 Lake Ave
- V/L 3-31 Willow St
- 7442 Worlington Dr
- 7368 Royal Portrush Dr
- 1000 Michigan St
- 10168 Spinnaker Run Unit I
- 10168 Spinnaker Run Unit 71
- 10170 Spinnaker Run Unit 7H
- 10166 Spinnaker Run
- 10172 Spinnaker Run
- 10172 Spinnaker Run Unit 7G
- 10174 Spinnaker Run
- 10162 Spinnaker Run
- 10176 Spinnaker Run
- 10160 Spinnaker Run
- 10178 Spinnaker Run Unit 7D
- 10178 Spinnaker Run Unit D7
- 10158 Spinnaker Run Unit 9C
- 10200 Pirates Trail
- 10180 Spinnaker Run
- 10156 Spinnaker Run Unit 9D
- 10192 Pirates Trail
- 10208 Pirates Trail
- 10182 Spinnaker Run
- 10231 Spinnaker Run Unit 8K
Your Personal Tour Guide
Ask me questions while you tour the home.