
Seller's Agent in 2025
Chris Schwieger
Woods Bros Realty
(308) 379-3275
7 in this area
221 Total Sales
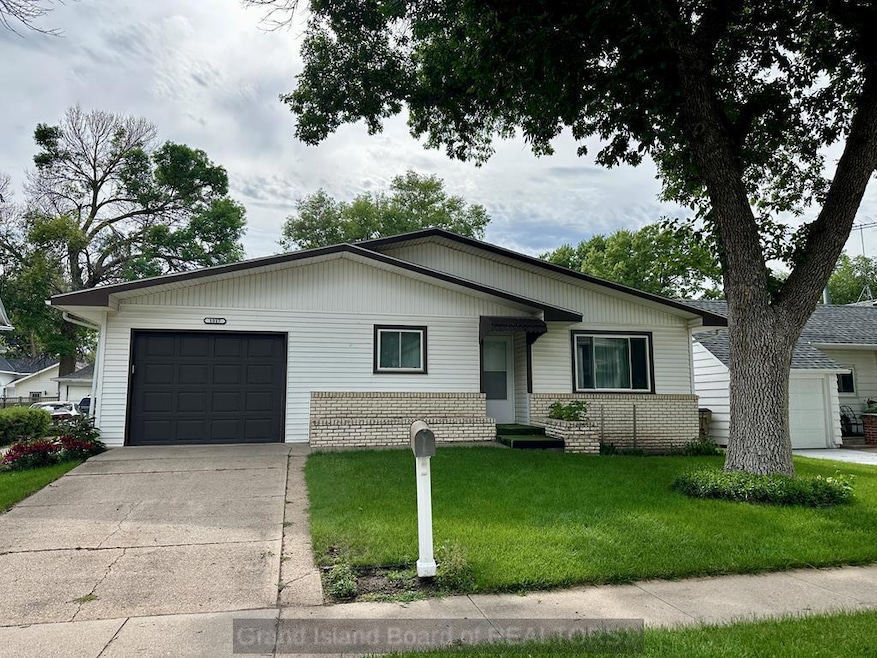
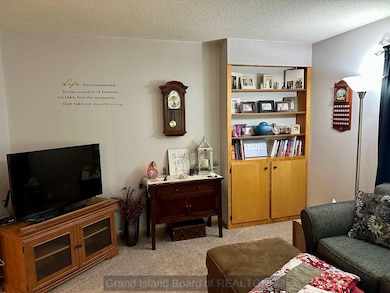
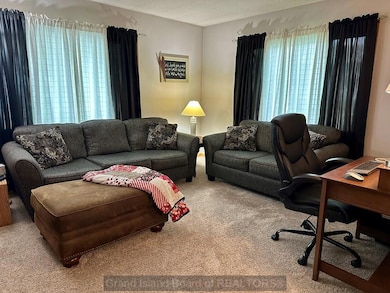
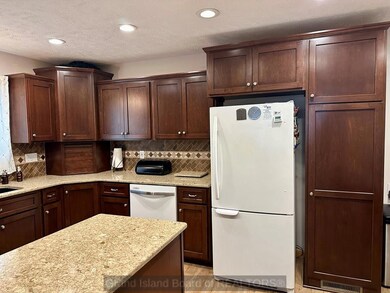
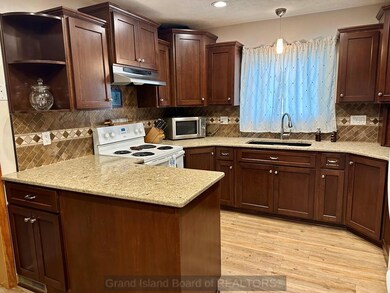
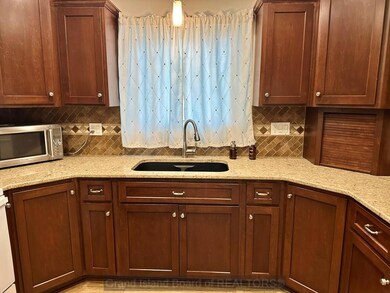
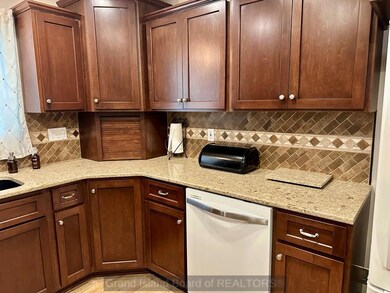
Updated 1,112 sq ft bungalow with partial basement, just minutes from downtown. The kitchen is stunning with the dark rich cabinets, tiled backsplash with a fun design and quartz countertops! On the main floor you will find 2 bedrooms, a full bath and .75 primary bathroom as well as the laundry. Downstairs is a nice size family room, bonus room and utility room with a .5 bath and storage area. The one car garage is attached, UGS and covered patio.
Last Agent to Sell the Property
Woods Bros Realty License #20030069 Listed on: 06/18/2025
| Date | Type | Sale Price | Title Company |
|---|---|---|---|
| Warranty Deed | $201,000 | Nebraska Title | |
| Warranty Deed | $80,000 | -- | |
| Warranty Deed | $70,000 | -- |
| Date | Status | Loan Amount | Loan Type |
|---|---|---|---|
| Previous Owner | $66,500 | No Value Available |
| Date | Event | Price | List to Sale | Price per Sq Ft |
|---|---|---|---|---|
| 07/17/2025 07/17/25 | Sold | $201,000 | +1.0% | $181 / Sq Ft |
| 06/24/2025 06/24/25 | Pending | -- | -- | -- |
| 06/20/2025 06/20/25 | For Sale | $199,000 | 0.0% | $179 / Sq Ft |
| 06/20/2025 06/20/25 | Pending | -- | -- | -- |
| 06/18/2025 06/18/25 | For Sale | $199,000 | -- | $179 / Sq Ft |
| Year | Tax Paid | Tax Assessment Tax Assessment Total Assessment is a certain percentage of the fair market value that is determined by local assessors to be the total taxable value of land and additions on the property. | Land | Improvement |
|---|---|---|---|---|
| 2025 | $1,343 | $145,115 | $8,250 | $136,865 |
| 2024 | $1,343 | $123,840 | $8,250 | $115,590 |
| 2023 | $1,613 | $114,295 | $8,250 | $106,045 |
| 2022 | $1,710 | $114,295 | $8,250 | $106,045 |
| 2021 | $1,738 | $114,295 | $8,250 | $106,045 |
| 2020 | $1,499 | $101,160 | $8,250 | $92,910 |
| 2019 | $1,388 | $94,280 | $8,250 | $86,030 |
| 2018 | $1,327 | $94,280 | $8,250 | $86,030 |
| 2017 | $1,282 | $90,980 | $4,950 | $86,030 |
| 2016 | $1,118 | $81,700 | $4,950 | $76,750 |
| 2010 | $1,499 | $79,075 | $0 | $0 |
Seller's Agent in 2025
Chris Schwieger
Woods Bros Realty
(308) 379-3275
7 in this area
221 Total Sales
Buyer's Agent in 2025
Diane Lewis
Woods Bros Realty
(402) 469-6759
2 in this area
53 Total Sales
Source: Grand Island Board of REALTORS®
MLS Number: 20250577
APN: 0410045640
Ask me questions while you tour the home.