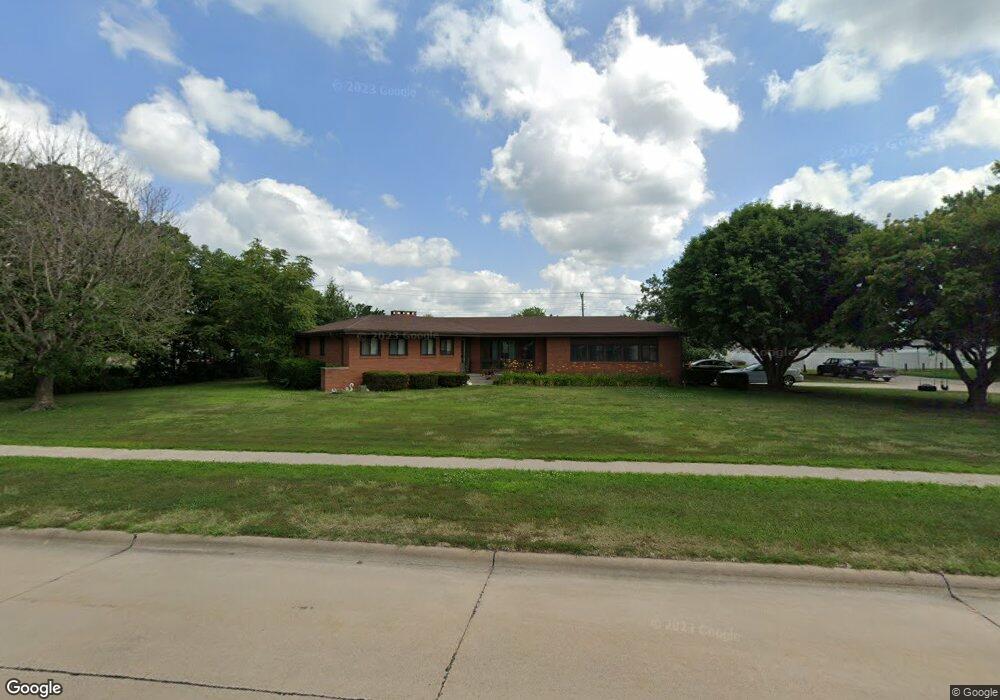
1017 1st St Gibbon, NE 68840
Estimated Value: $272,397 - $317,000
--
Bed
1
Bath
1,651
Sq Ft
$182/Sq Ft
Est. Value
About This Home
This home is located at 1017 1st St, Gibbon, NE 68840 and is currently estimated at $300,849, approximately $182 per square foot. 1017 1st St is a home with nearby schools including Gibbon Elementary School and Gibbon High School.
Ownership History
Date
Name
Owned For
Owner Type
Purchase Details
Closed on
Mar 23, 2007
Sold by
Bond Darren R and Arredondo Stacy D
Bought by
Hernandez Francisco and Pedraza-Hernandez Evangelina
Current Estimated Value
Home Financials for this Owner
Home Financials are based on the most recent Mortgage that was taken out on this home.
Original Mortgage
$147,000
Outstanding Balance
$88,880
Interest Rate
6.24%
Estimated Equity
$211,969
Purchase Details
Closed on
Apr 20, 2005
Sold by
Mcgregor Duncan B and Mcgregor Janice E
Bought by
Bond Darren R and Arredondo Stacy D
Create a Home Valuation Report for This Property
The Home Valuation Report is an in-depth analysis detailing your home's value as well as a comparison with similar homes in the area
Home Values in the Area
Average Home Value in this Area
Purchase History
| Date | Buyer | Sale Price | Title Company |
|---|---|---|---|
| Hernandez Francisco | $150,000 | Vintage Title | |
| Bond Darren R | $135,900 | Rels Title |
Source: Public Records
Mortgage History
| Date | Status | Borrower | Loan Amount |
|---|---|---|---|
| Open | Hernandez Francisco | $147,000 | |
| Closed | Bond Darren R | $0 |
Source: Public Records
Tax History Compared to Growth
Tax History
| Year | Tax Paid | Tax Assessment Tax Assessment Total Assessment is a certain percentage of the fair market value that is determined by local assessors to be the total taxable value of land and additions on the property. | Land | Improvement |
|---|---|---|---|---|
| 2025 | $4,656 | $285,700 | $23,355 | $262,345 |
| 2024 | $4,656 | $272,570 | $23,355 | $249,215 |
| 2023 | $5,281 | $266,100 | $23,355 | $242,745 |
| 2022 | $4,403 | $219,760 | $23,355 | $196,405 |
| 2021 | $4,121 | $201,490 | $23,355 | $178,135 |
| 2020 | $4,024 | $198,855 | $23,355 | $175,500 |
| 2019 | $3,973 | $193,475 | $23,355 | $170,120 |
| 2018 | $3,857 | $188,330 | $23,355 | $164,975 |
| 2017 | $3,711 | $186,375 | $23,355 | $163,020 |
| 2016 | $3,147 | $165,000 | $23,355 | $141,645 |
| 2015 | $3,047 | $157,090 | $0 | $0 |
| 2014 | $3,058 | $143,680 | $0 | $0 |
Source: Public Records
Map
Nearby Homes