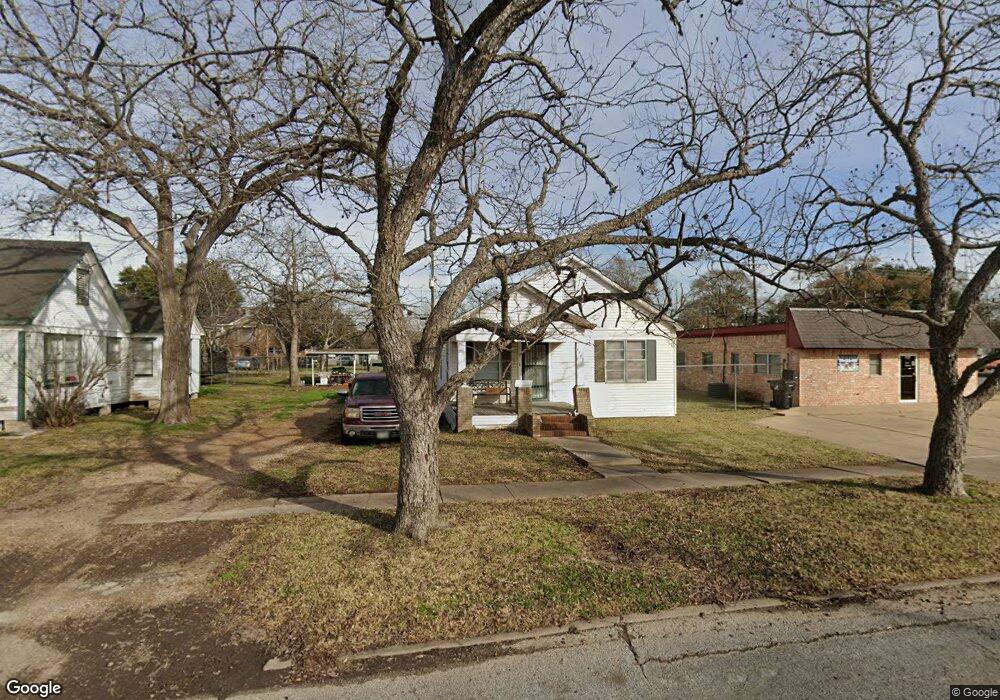
1017 7th St Rosenberg, TX 77471
Estimated Value: $183,214 - $228,000
3
Beds
2
Baths
1,429
Sq Ft
$145/Sq Ft
Est. Value
About This Home
This home is located at 1017 7th St, Rosenberg, TX 77471 and is currently estimated at $207,054, approximately $144 per square foot. 1017 7th St is a home located in Fort Bend County with nearby schools including Travis Elementary School, George Junior High School, and B.F. Terry High School.
Ownership History
Date
Name
Owned For
Owner Type
Purchase Details
Closed on
Oct 31, 2023
Sold by
Mensik Jonathon Allen and Mensik Jeremy Ray
Bought by
Mensik Raymond Paul
Current Estimated Value
Purchase Details
Closed on
Aug 5, 2010
Sold by
Mensik Raymond P
Bought by
Mensik Allen R
Purchase Details
Closed on
Feb 2, 2001
Sold by
Mensik Marvin M
Bought by
Mensik Raymond P
Home Financials for this Owner
Home Financials are based on the most recent Mortgage that was taken out on this home.
Original Mortgage
$50,000
Interest Rate
7.21%
Mortgage Type
Seller Take Back
Create a Home Valuation Report for This Property
The Home Valuation Report is an in-depth analysis detailing your home's value as well as a comparison with similar homes in the area
Home Values in the Area
Average Home Value in this Area
Purchase History
| Date | Buyer | Sale Price | Title Company |
|---|---|---|---|
| Mensik Raymond Paul | -- | None Listed On Document | |
| Mensik Allen R | -- | None Available | |
| Mensik Raymond P | -- | -- |
Source: Public Records
Mortgage History
| Date | Status | Borrower | Loan Amount |
|---|---|---|---|
| Previous Owner | Mensik Raymond P | $50,000 |
Source: Public Records
Tax History
| Year | Tax Paid | Tax Assessment Tax Assessment Total Assessment is a certain percentage of the fair market value that is determined by local assessors to be the total taxable value of land and additions on the property. | Land | Improvement |
|---|---|---|---|---|
| 2025 | $3,850 | $167,347 | $69,771 | $97,576 |
| 2024 | $3,850 | $203,807 | $69,771 | $134,036 |
| 2023 | $2,946 | $152,606 | $54,196 | $98,410 |
| 2022 | $281 | $77,210 | $24,250 | $52,960 |
| 2021 | $1,456 | $70,190 | $49,290 | $20,900 |
| 2020 | $1,354 | $63,810 | $48,620 | $15,190 |
| 2019 | $1,325 | $58,010 | $29,410 | $28,600 |
| 2018 | $1,304 | $56,170 | $29,410 | $26,760 |
| 2017 | $1,289 | $55,230 | $29,410 | $25,820 |
| 2016 | $1,290 | $55,260 | $29,410 | $25,850 |
| 2015 | $877 | $55,490 | $29,410 | $26,080 |
| 2014 | $1,028 | $55,420 | $29,410 | $26,010 |
Source: Public Records
Map
Nearby Homes
Your Personal Tour Guide
Ask me questions while you tour the home.