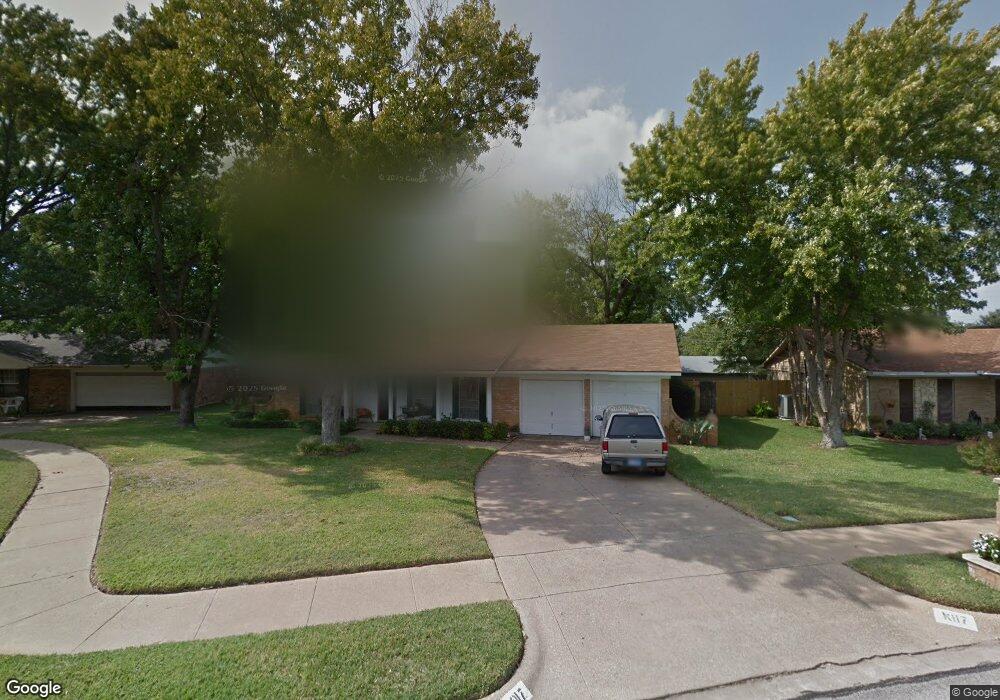
1017 Atlanta Dr Bedford, TX 76022
Estimated Value: $297,000 - $374,000
3
Beds
2
Baths
1,424
Sq Ft
$229/Sq Ft
Est. Value
About This Home
This home is located at 1017 Atlanta Dr, Bedford, TX 76022 and is currently estimated at $326,157, approximately $229 per square foot. 1017 Atlanta Dr is a home located in Tarrant County with nearby schools including Bell Manor Elementary School, Central J High School, and Trinity High School.
Ownership History
Date
Name
Owned For
Owner Type
Purchase Details
Closed on
Mar 30, 2007
Sold by
Karr Lori Mae
Bought by
Blackwell Joel and Blackwell Janice
Current Estimated Value
Home Financials for this Owner
Home Financials are based on the most recent Mortgage that was taken out on this home.
Original Mortgage
$110,968
Outstanding Balance
$67,646
Interest Rate
6.3%
Mortgage Type
Purchase Money Mortgage
Estimated Equity
$258,511
Purchase Details
Closed on
Jun 24, 2003
Sold by
Karr David Allen
Bought by
Karr Lori Mae
Purchase Details
Closed on
May 21, 2001
Sold by
Lough Judy Lynn
Bought by
Karr David A and Karr Lori M
Home Financials for this Owner
Home Financials are based on the most recent Mortgage that was taken out on this home.
Original Mortgage
$106,331
Interest Rate
6.99%
Mortgage Type
FHA
Purchase Details
Closed on
Jul 30, 1998
Sold by
Lough Bobby
Bought by
Lough Judy
Create a Home Valuation Report for This Property
The Home Valuation Report is an in-depth analysis detailing your home's value as well as a comparison with similar homes in the area
Home Values in the Area
Average Home Value in this Area
Purchase History
| Date | Buyer | Sale Price | Title Company |
|---|---|---|---|
| Blackwell Joel | -- | Sendera Title | |
| Karr Lori Mae | -- | -- | |
| Karr David A | -- | Commonwealth Land Title | |
| Lough Judy | -- | -- |
Source: Public Records
Mortgage History
| Date | Status | Borrower | Loan Amount |
|---|---|---|---|
| Open | Blackwell Joel | $110,968 | |
| Previous Owner | Karr David A | $106,331 |
Source: Public Records
Tax History Compared to Growth
Tax History
| Year | Tax Paid | Tax Assessment Tax Assessment Total Assessment is a certain percentage of the fair market value that is determined by local assessors to be the total taxable value of land and additions on the property. | Land | Improvement |
|---|---|---|---|---|
| 2025 | $1,532 | $185,000 | $65,000 | $120,000 |
| 2024 | $1,532 | $212,321 | $65,000 | $147,321 |
| 2023 | $3,411 | $180,000 | $45,000 | $135,000 |
| 2022 | $3,531 | $161,678 | $45,000 | $116,678 |
| 2021 | $3,808 | $161,678 | $45,000 | $116,678 |
| 2020 | $4,453 | $187,277 | $45,000 | $142,277 |
| 2019 | $4,194 | $188,583 | $45,000 | $143,583 |
| 2018 | $3,430 | $156,925 | $23,000 | $133,925 |
| 2017 | $3,451 | $151,109 | $23,000 | $128,109 |
| 2016 | $3,137 | $135,609 | $23,000 | $112,609 |
| 2015 | $2,686 | $117,900 | $18,000 | $99,900 |
| 2014 | $2,686 | $117,900 | $18,000 | $99,900 |
Source: Public Records
Map
Nearby Homes
- 933 Charleston Ct
- 1613 Trinity Ct
- 1701 Winchester Way
- 952 Charleston Dr
- 1604 Richmond Dr
- 804 Natchez Ave
- 2024 Charleston Dr
- 1031 Boston Blvd
- 2101 Gettysburg Place
- 904 Nelson Terrace
- 2025 Schumac Ln
- 2201 Greendale Ct
- 1004 Overhill Dr
- 921 Overhill Dr
- 909 Overhill Dr
- 1213 Greendale Dr
- 828 Gregory Ave
- 808 Gregory Ave
- 1049 Stableway Ln
- 1509 Shirley Way
- 1021 Atlanta Dr
- 1013 Atlanta Dr
- 1016 Monterrey St
- 1025 Atlanta Dr
- 1012 Monterrey St
- 1020 Monterrey St
- 1016 Atlanta Dr
- 1009 Atlanta Dr
- 1008 Atlanta Dr
- 1005 Atlanta Dr Unit 4
- 1008 Monterrey St
- 1020 Atlanta Dr
- 1024 Monterrey St
- 1029 Atlanta Dr
- 1004 Monterrey St
- 1609 Trinity Ct
- 1028 Monterrey St
- 1000 Atlanta Dr
- 1024 Atlanta Dr
- 1001 Atlanta Dr