Estimated Value: $86,000 - $140,000
--
Bed
1
Bath
1,114
Sq Ft
$95/Sq Ft
Est. Value
About This Home
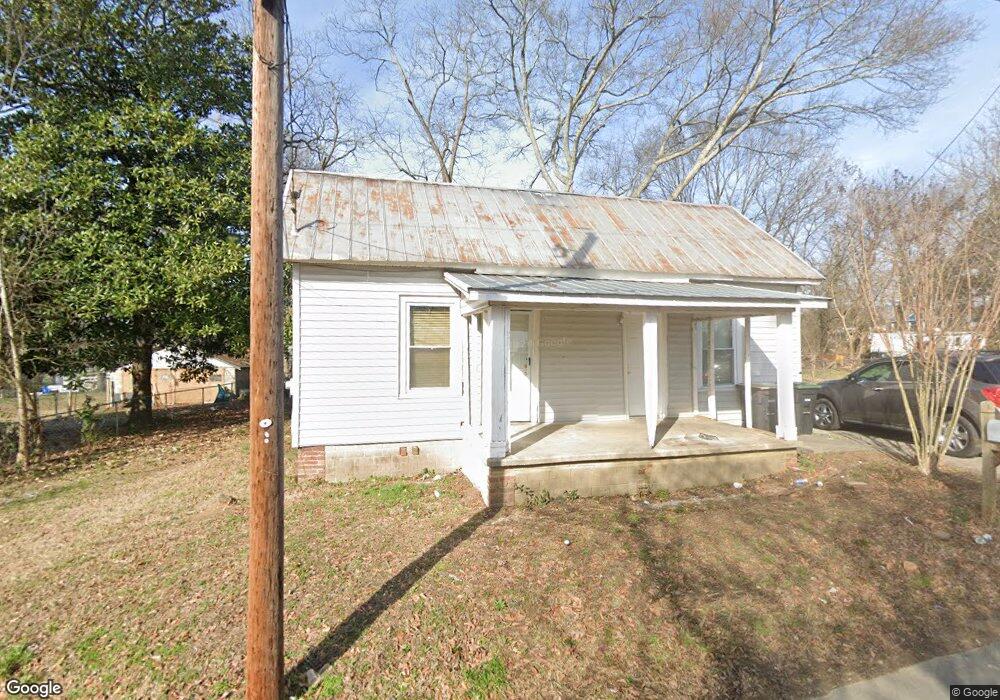
This home is located at 1017 Avenue D NW, Rome, GA 30165 and is currently estimated at $106,017, approximately $95 per square foot. 1017 Avenue D NW is a home located in Floyd County with nearby schools including Rome High School, St. Mary School, and Darlington School.
Ownership History
Date
Name
Owned For
Owner Type
Purchase Details
Closed on
Dec 13, 2005
Sold by
Morgan Raymond E
Bought by
Walstad Martha B
Current Estimated Value
Purchase Details
Closed on
Feb 21, 1998
Sold by
Morgan Raymond E
Bought by
Howard Jane
Purchase Details
Closed on
Aug 13, 1997
Sold by
Morgan Raymond E
Bought by
Morgan Raymond E
Purchase Details
Closed on
Mar 28, 1985
Sold by
Morris Christopher
Bought by
Morgan Raymond E
Purchase Details
Closed on
Feb 11, 1981
Bought by
P and R
Purchase Details
Closed on
Nov 11, 1980
Sold by
Morris Beatrice P and Morris Christopher
Bought by
Morris Christopher
Purchase Details
Closed on
Apr 4, 1980
Sold by
Morris Roy B
Bought by
Morris Beatrice P and Morris Christopher
Purchase Details
Closed on
Jan 1, 1974
Sold by
Morris Morris B and Morris Wife
Bought by
Morris Roy B
Purchase Details
Closed on
Jan 1, 1901
Bought by
Morris Morris B and Morris Wife
Create a Home Valuation Report for This Property
The Home Valuation Report is an in-depth analysis detailing your home's value as well as a comparison with similar homes in the area
Home Values in the Area
Average Home Value in this Area
Purchase History
| Date | Buyer | Sale Price | Title Company |
|---|---|---|---|
| Walstad Martha B | $5,500 | -- | |
| Howard Jane | -- | -- | |
| Morgan Raymond E | -- | -- | |
| Morgan Raymond E | $12,700 | -- | |
| P | -- | -- | |
| Morris Christopher | -- | -- | |
| Morris Beatrice P | -- | -- | |
| Morris Roy B | -- | -- | |
| Morris Morris B | -- | -- |
Source: Public Records
Tax History Compared to Growth
Tax History
| Year | Tax Paid | Tax Assessment Tax Assessment Total Assessment is a certain percentage of the fair market value that is determined by local assessors to be the total taxable value of land and additions on the property. | Land | Improvement |
|---|---|---|---|---|
| 2024 | $1,230 | $32,946 | $7,057 | $25,889 |
| 2023 | $1,167 | $26,546 | $6,273 | $20,273 |
| 2022 | $854 | $23,400 | $5,227 | $18,173 |
| 2021 | $701 | $18,900 | $5,227 | $13,673 |
| 2020 | $564 | $15,084 | $3,920 | $11,164 |
| 2019 | $529 | $14,285 | $3,920 | $10,365 |
| 2018 | $499 | $13,486 | $3,920 | $9,566 |
| 2017 | $481 | $12,998 | $3,920 | $9,078 |
| 2016 | $528 | $14,224 | $3,920 | $10,304 |
| 2015 | $497 | $14,181 | $3,920 | $10,261 |
| 2014 | $497 | $14,181 | $3,920 | $10,261 |
Source: Public Records
Map
Nearby Homes
- 1018 N 2nd Ave NW
- 1005 N 2nd Ave NW Unit 39
- PEARSON Plan at Shorter Village
- 527 W 11th St NE
- 0 Unbridled Rd Unit 22 23074684
- 601 W 10th St NE
- 1006 Avenue A NE
- 6 Horseleg Creek Rd SW
- 4 Colonial Dr NW
- 204 Oakwood St NW
- 7 Raymond Ave NW
- 9 Shorter Cir SW
- 209 Sherwood Rd SW
- 1 E 3rd Ave Unit 302
- 17 Rosewood Rd SW
- 101 Hardy Ave SW
- 14 Vineland Dr NW
- 19 Berckman Ln SW
- 202 E 4th Ave Unit 5
- 202 E 4th Ave
- 1015 Avenue D NW
- 1015 Ave d
- 308 McDonald St NW
- 304 McDonald St NW
- 1013 Avenue D NW
- 300 McDonald St NW
- 1016 Avenue D NW
- 400 McDonald St NW
- 1014 Avenue D NW
- 1009 Avenue D NW
- 1008 Desoto Ave NW
- 0 Desoto Ave NW Unit 7509705
- 0 Desoto Ave NW Unit 7033111
- 0 Desoto Ave NW Unit 8244559
- 0 Desoto Ave NW Unit 8699605
- 0 Desoto Ave NW
- 1105 Martha Berry Blvd NE
- 309 McDonald St NW
- 1007 Avenue D NW
- 1006 Desoto Ave NW