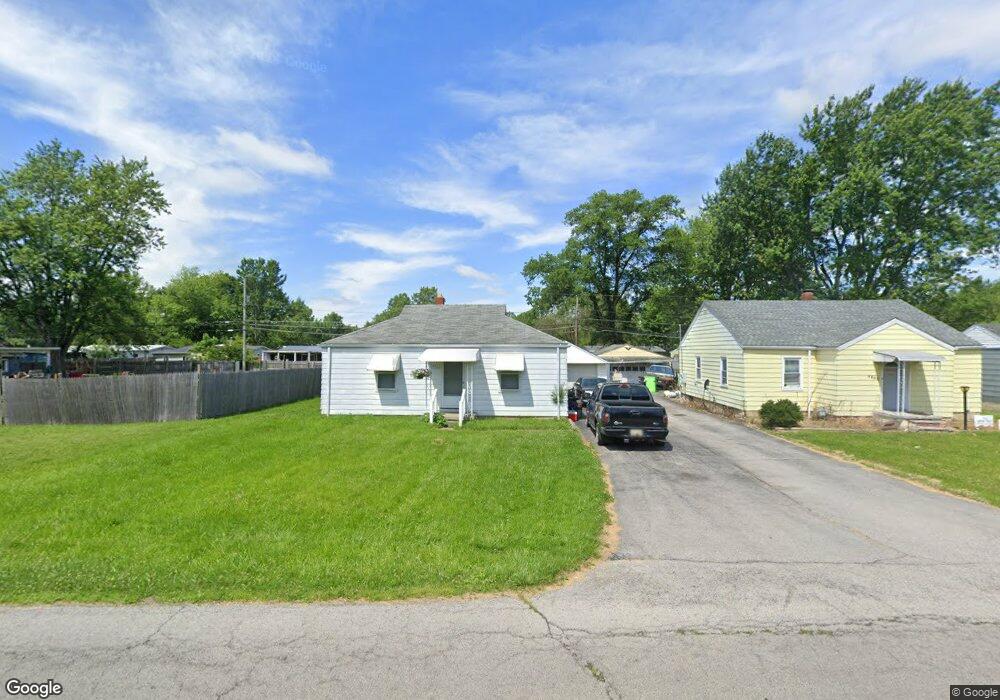
1017 Buckley St Fostoria, OH 44830
Estimated Value: $70,000 - $139,000
2
Beds
1
Bath
768
Sq Ft
$137/Sq Ft
Est. Value
About This Home
This home is located at 1017 Buckley St, Fostoria, OH 44830 and is currently estimated at $105,128, approximately $136 per square foot. 1017 Buckley St is a home located in Seneca County with nearby schools including Fostoria Intermediate Elementary School and Fostoria Junior/Senior High School.
Ownership History
Date
Name
Owned For
Owner Type
Purchase Details
Closed on
Feb 27, 2024
Sold by
Kelly Charles F and Kelly Brenda
Bought by
Kelly Charles F and Kelly Brenda
Current Estimated Value
Purchase Details
Closed on
Jul 10, 2023
Sold by
Kelly Charles F and Kelly Brenda
Bought by
Rice Troy W and Rice Stephanie
Purchase Details
Closed on
May 31, 2023
Sold by
Kelly Charles F and Kelly Brenda Kay
Bought by
Kelly Charles F and Kelly Brenda Kay
Purchase Details
Closed on
Jul 27, 2022
Sold by
Jamie Roth
Bought by
Kelly Charles F and Kelly Brenda
Purchase Details
Closed on
Feb 27, 2022
Sold by
Kelly Charles F and Kelly Brenda
Bought by
Rice Troy W and Rice Stephanie
Purchase Details
Closed on
Dec 10, 2003
Sold by
Roth Donald J and Roth Mary C
Bought by
Roth Donald and Roth Mary C
Purchase Details
Closed on
Jan 2, 2002
Sold by
Roth Donald
Bought by
Roth Donald
Create a Home Valuation Report for This Property
The Home Valuation Report is an in-depth analysis detailing your home's value as well as a comparison with similar homes in the area
Home Values in the Area
Average Home Value in this Area
Purchase History
| Date | Buyer | Sale Price | Title Company |
|---|---|---|---|
| Kelly Charles F | -- | None Listed On Document | |
| Kelly Charles F | -- | None Listed On Document | |
| Rice Troy W | -- | Wolph Title | |
| Rice Troy W | -- | Wolph Title | |
| Kelly Charles F | -- | None Listed On Document | |
| Kelly Charles F | -- | None Listed On Document | |
| Kelly Charles F | $15,000 | -- | |
| Kelly Charles F | $15,000 | Wolph Title | |
| Rice Troy W | -- | None Listed On Document | |
| Rice Troy W | -- | None Listed On Document | |
| Roth Donald | -- | None Available | |
| Roth Donald | -- | -- |
Source: Public Records
Tax History Compared to Growth
Tax History
| Year | Tax Paid | Tax Assessment Tax Assessment Total Assessment is a certain percentage of the fair market value that is determined by local assessors to be the total taxable value of land and additions on the property. | Land | Improvement |
|---|---|---|---|---|
| 2024 | $915 | $17,150 | $2,890 | $14,260 |
| 2023 | $1,027 | $17,150 | $2,890 | $14,260 |
| 2022 | $292 | $13,870 | $2,990 | $10,880 |
| 2021 | $391 | $13,870 | $2,990 | $10,880 |
| 2020 | $273 | $13,871 | $2,989 | $10,882 |
| 2019 | $273 | $13,388 | $2,884 | $10,504 |
| 2018 | $278 | $13,388 | $2,884 | $10,504 |
| 2017 | $278 | $13,388 | $2,884 | $10,504 |
| 2016 | $206 | $12,576 | $3,031 | $9,545 |
| 2015 | $202 | $12,576 | $3,031 | $9,545 |
| 2014 | $193 | $12,576 | $3,031 | $9,545 |
| 2013 | $260 | $13,521 | $3,297 | $10,224 |
Source: Public Records
Map
Nearby Homes
- 827 Buckley St
- 711 Circle Dr
- 207 W Culbertson St
- 633 Maple St
- 481 Beverly Dr
- 1324 N Union St
- 540 N Poplar St
- 931 N Union St
- 375 Thomas St
- 220 E High St
- 900 N Countyline St
- 892 N Countyline St
- 723 N Union St
- 520 N Union St
- 321 Mcdougal St
- 412 E Center St
- 901 Central Ave
- 203 N Union St
- 727 Eisenhower Dr
- 429 S Town St
- 1019 Buckley St
- 1015 Buckley St
- 1021 Buckley St
- 1013 Buckley St
- 1032 Cherry St
- 1011 Buckley St
- 1044 Cherry St
- 1048 Cherry St
- 1028 Cherry St
- 1101 Buckley St
- 1009 Buckley St
- 1024 Cherry St
- 1020 Buckley St
- 1010 Buckley St
- 1007 Buckley St
- 1018 Buckley St
- 1102 Buckley St
- 1035 Cherry St
- 1111 Buckley St
- 1104 Buckley St