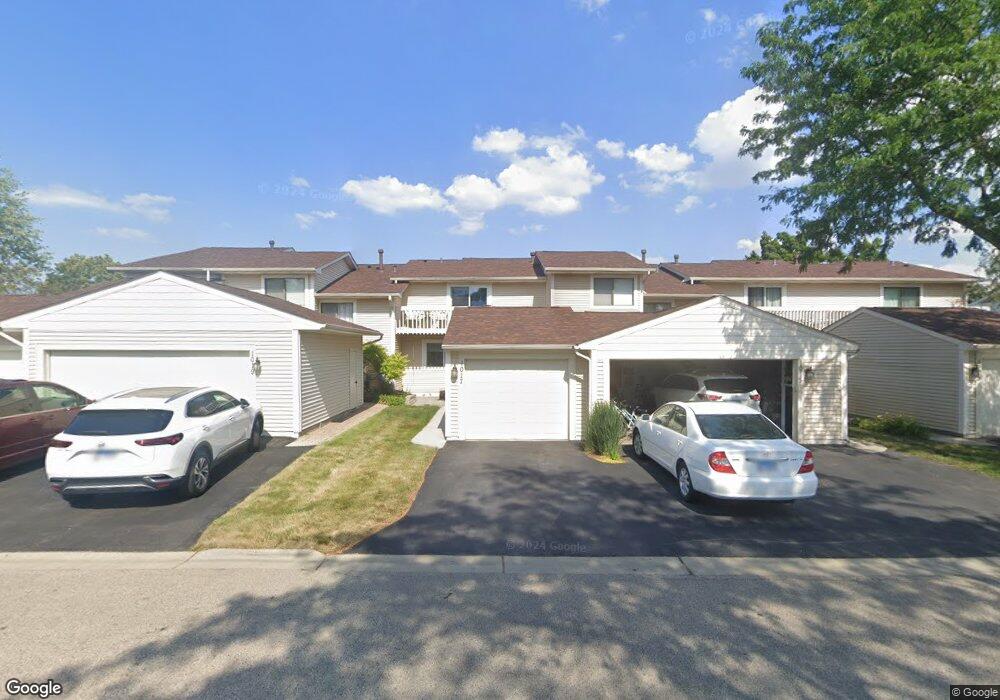
1017 Chatham Ct Vernon Hills, IL 60061
Estimated Value: $337,000 - $370,000
3
Beds
2
Baths
1,364
Sq Ft
$256/Sq Ft
Est. Value
About This Home
This home is located at 1017 Chatham Ct, Vernon Hills, IL 60061 and is currently estimated at $348,774, approximately $255 per square foot. 1017 Chatham Ct is a home located in Lake County with nearby schools including Hawthorn School Of Dual Language, Hawthorn Townline Elementary School, and Hawthorn Middle School North.
Ownership History
Date
Name
Owned For
Owner Type
Purchase Details
Closed on
Jun 18, 2021
Sold by
Sunnywood Holdings Llc-Series C
Bought by
Flentge George A and Fitzgerald Adrienne L
Current Estimated Value
Home Financials for this Owner
Home Financials are based on the most recent Mortgage that was taken out on this home.
Original Mortgage
$192,000
Outstanding Balance
$176,625
Interest Rate
3.99%
Mortgage Type
New Conventional
Estimated Equity
$172,149
Purchase Details
Closed on
Oct 15, 2012
Sold by
Federal National Mortgage Association
Bought by
Sunywood Holdings Llc
Purchase Details
Closed on
Jan 23, 2012
Sold by
Kudrikov Leonid and Wells Fargo Bank Na
Bought by
Federal National Mortgage Association
Purchase Details
Closed on
Mar 25, 1998
Sold by
Kuretich Margaret
Bought by
Kudrikov Leonid and Koshman Tatyana
Home Financials for this Owner
Home Financials are based on the most recent Mortgage that was taken out on this home.
Original Mortgage
$120,650
Interest Rate
7.19%
Create a Home Valuation Report for This Property
The Home Valuation Report is an in-depth analysis detailing your home's value as well as a comparison with similar homes in the area
Home Values in the Area
Average Home Value in this Area
Purchase History
| Date | Buyer | Sale Price | Title Company |
|---|---|---|---|
| Flentge George A | $250,000 | Burnet Title | |
| Sunywood Holdings Llc | $97,000 | Premier Title | |
| Federal National Mortgage Association | -- | Premier Title | |
| Kudrikov Leonid | $127,000 | Chicago Title Insurance Co |
Source: Public Records
Mortgage History
| Date | Status | Borrower | Loan Amount |
|---|---|---|---|
| Open | Flentge George A | $192,000 | |
| Previous Owner | Kudrikov Leonid | $120,650 |
Source: Public Records
Tax History Compared to Growth
Tax History
| Year | Tax Paid | Tax Assessment Tax Assessment Total Assessment is a certain percentage of the fair market value that is determined by local assessors to be the total taxable value of land and additions on the property. | Land | Improvement |
|---|---|---|---|---|
| 2024 | $6,662 | $85,973 | $25,980 | $59,993 |
| 2023 | $6,660 | $79,296 | $23,962 | $55,334 |
| 2022 | $6,660 | $77,350 | $23,033 | $54,317 |
| 2021 | $6,917 | $75,685 | $22,537 | $53,148 |
| 2020 | $6,672 | $74,412 | $22,158 | $52,254 |
| 2019 | $6,502 | $73,704 | $21,947 | $51,757 |
| 2018 | $5,572 | $63,259 | $21,857 | $41,402 |
| 2017 | $5,412 | $61,262 | $21,167 | $40,095 |
| 2016 | $5,205 | $58,085 | $20,069 | $38,016 |
| 2015 | $5,147 | $54,290 | $18,758 | $35,532 |
| 2014 | $3,111 | $51,491 | $18,506 | $32,985 |
| 2012 | $4,387 | $51,938 | $18,667 | $33,271 |
Source: Public Records
Map
Nearby Homes
- 1028 Cumberland Ct
- 1109 Grant Place
- 15 Crestview Ln Unit 4
- 365 Jefferson Ct Unit 65
- 11 Echo Ct Unit 12
- 464 Buchanan Ct
- 4 Parkside Ct Unit 12
- 139 Windsor Dr Unit 123
- 608 Sycamore St
- 717 Summit Ln
- 1434 Maidstone Dr
- 900 S Butterfield Rd
- 215 Coventry Cir Unit 215
- 240 Southwick Ct Unit 52
- 1654 Pebble Beach Way
- 1290 Butterfield Rd
- 1688 Saint Andrew Dr
- 410 Bay Tree Cir
- 418 Bay Tree Cir
- 668 Portage Ct Unit 345
- 1015 Chatham Place
- 1013 Chatham Place
- 1017 Chatham Place Unit 10
- 1019 Chatham Place
- 1011 Chatham Place Unit 10
- 1021 Chatham Place
- 1009 Chatham Place Unit 10
- 211 Chesapeake Ct
- 1023 Chatham Place Unit 10
- 1007 Chatham Place Unit 10
- 213 Chesapeake Ct Unit 10
- 1005 Chatham Place
- 215 Chesapeake Ct Unit 10
- 1025 Chatham Place
- 214 Chesapeake Ct
- 1003 Chatham Place Unit 10
- 216 Chesapeake Ct
- 1027 Chatham Place
- 1001 Chatham Place Unit 10
- 218 Chesapeake Ct