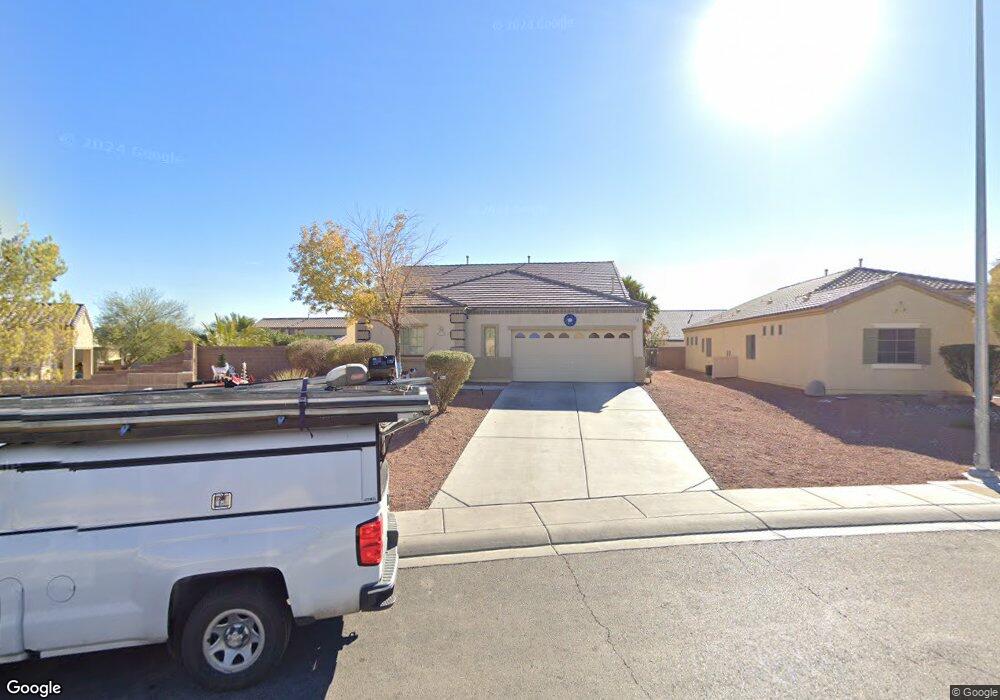
1017 E Bob Barney Ct North Las Vegas, NV 89086
Deer Springs NeighborhoodEstimated Value: $489,396 - $498,000
3
Beds
3
Baths
2,361
Sq Ft
$209/Sq Ft
Est. Value
About This Home
This home is located at 1017 E Bob Barney Ct, North Las Vegas, NV 89086 and is currently estimated at $493,849, approximately $209 per square foot. 1017 E Bob Barney Ct is a home located in Clark County with nearby schools including Don E. Hayden Elementary School, Ruby Duncan Elementary School, and Carroll M. Johnston STEM Academy of Environmental Studies.
Ownership History
Date
Name
Owned For
Owner Type
Purchase Details
Closed on
Apr 15, 2025
Sold by
Moran Donis G
Bought by
Moran Donis G and Moran Rose Marie
Current Estimated Value
Purchase Details
Closed on
Jul 26, 2013
Sold by
Rathbun Shae M
Bought by
Moran Donis
Purchase Details
Closed on
Mar 9, 2009
Sold by
Nationstar Mortgage Llc
Bought by
Rathbun Shae M
Home Financials for this Owner
Home Financials are based on the most recent Mortgage that was taken out on this home.
Original Mortgage
$171,731
Interest Rate
5.15%
Mortgage Type
Seller Take Back
Purchase Details
Closed on
Dec 31, 2008
Sold by
Smith Terrence and Smith Monica L
Bought by
Nationstar Mortgage Llc
Purchase Details
Closed on
Oct 17, 2005
Sold by
Centex Homes
Bought by
Smith Terrence and Smith Monica L
Home Financials for this Owner
Home Financials are based on the most recent Mortgage that was taken out on this home.
Original Mortgage
$331,200
Interest Rate
7.6%
Mortgage Type
Unknown
Create a Home Valuation Report for This Property
The Home Valuation Report is an in-depth analysis detailing your home's value as well as a comparison with similar homes in the area
Home Values in the Area
Average Home Value in this Area
Purchase History
| Date | Buyer | Sale Price | Title Company |
|---|---|---|---|
| Moran Donis G | -- | None Listed On Document | |
| Moran Donis | $215,000 | Equity Title Of Nevada | |
| Rathbun Shae M | $174,900 | Equity Title Eastern | |
| Nationstar Mortgage Llc | $305,603 | First American Title Ins Co | |
| Smith Terrence | $368,000 | Commerce Title |
Source: Public Records
Mortgage History
| Date | Status | Borrower | Loan Amount |
|---|---|---|---|
| Previous Owner | Rathbun Shae M | $171,731 | |
| Previous Owner | Smith Terrence | $331,200 |
Source: Public Records
Tax History Compared to Growth
Tax History
| Year | Tax Paid | Tax Assessment Tax Assessment Total Assessment is a certain percentage of the fair market value that is determined by local assessors to be the total taxable value of land and additions on the property. | Land | Improvement |
|---|---|---|---|---|
| 2025 | $2,666 | $145,241 | $36,750 | $108,491 |
| 2024 | $2,469 | $145,241 | $36,750 | $108,491 |
| 2023 | $2,469 | $136,913 | $34,300 | $102,613 |
| 2022 | $2,286 | $121,117 | $27,650 | $93,467 |
| 2021 | $2,117 | $109,416 | $25,900 | $83,516 |
| 2020 | $1,963 | $106,842 | $25,200 | $81,642 |
| 2019 | $1,840 | $96,064 | $21,000 | $75,064 |
| 2018 | $1,755 | $85,702 | $18,550 | $67,152 |
| 2017 | $2,668 | $79,546 | $15,750 | $63,796 |
| 2016 | $1,663 | $65,061 | $12,600 | $52,461 |
| 2015 | $1,659 | $52,907 | $9,450 | $43,457 |
| 2014 | $1,607 | $46,494 | $7,700 | $38,794 |
Source: Public Records
Map
Nearby Homes
- 916 Echo Beach Ave
- 846 Star Estates Ave
- 1129 Blissful Plains Ave
- 1409 Crystal Rainey Ave
- 1130 Blissful Plains Ave
- 1417 Crystal Rainey Ave
- 762 Star Estates Ave
- 1213 Bistro Bay Ave Unit 3
- 1509 Peyton Stewart Ct
- 1008 Oceanwood Ave
- 755 Glory Morning Ct
- 6512 N Bruce St
- 1023 Brilliant Meadow Ave
- 6425 Sierra Sands St
- 1115 Brilliant Meadow Ave
- 6472 Centennial Skies Ct
- 984 Brilliant Meadow Ave
- 1122 Brilliant Meadow Ave
- 6446 Silver Estates St
- 760 Crisp Morning Ct
- 1017 Bob Barney Ave
- 1013 Bob Barney Ave
- 6713 Johnny Love Ln
- 1016 Madaline Nicole Ave
- 1009 Bob Barney Ave
- 6709 Johnny Love Ln
- 1020 Madaline Nicole Ave
- 1012 Madaline Nicole Ave
- 6705 Johnny Love Ln
- 1008 Madaline Nicole Ave
- 1005 Bob Barney Ave
- 1024 Madaline Nicole Ave
- 1005 E Bob Barney Ct Unit N
- 1012 Bob Barney Ave
- 1016 Bob Barney Ave
- 6653 Johnny Love Ln
- 6653 Johnny Love Ln
- 1008 Bob Barney Ave
- 1004 Madaline Nicole Ave
- 921 Bob Barney Ave