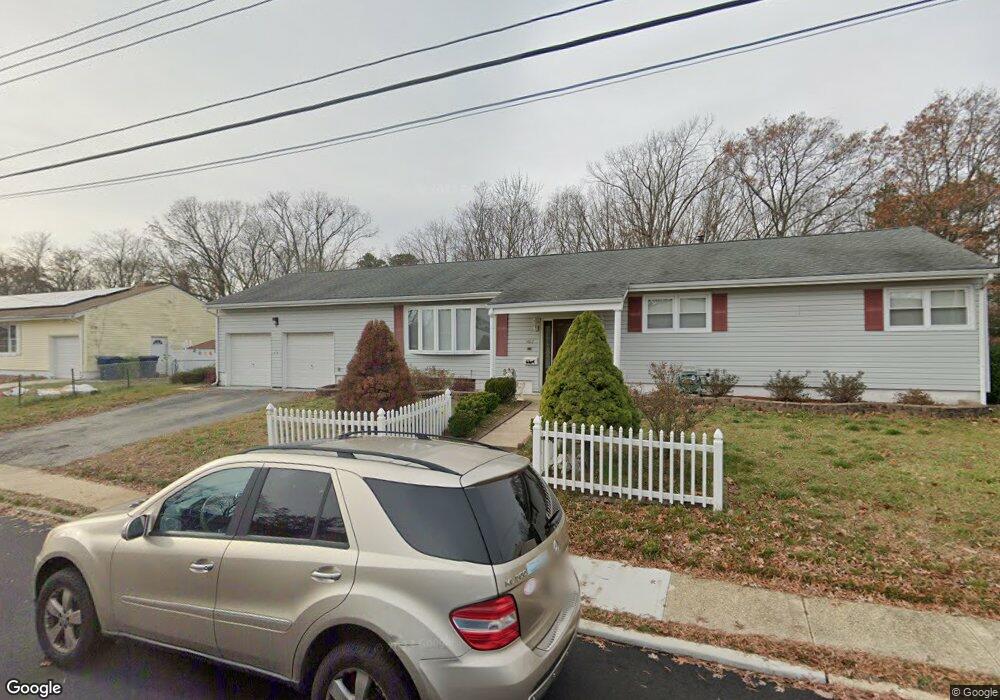
1017 Fordham Rd Neptune, NJ 07753
Estimated Value: $540,000 - $645,000
3
Beds
3
Baths
1,456
Sq Ft
$408/Sq Ft
Est. Value
About This Home
This home is located at 1017 Fordham Rd, Neptune, NJ 07753 and is currently estimated at $594,714, approximately $408 per square foot. 1017 Fordham Rd is a home located in Monmouth County with nearby schools including Neptune High School.
Ownership History
Date
Name
Owned For
Owner Type
Purchase Details
Closed on
Feb 15, 2022
Sold by
Remiah Tubig
Bought by
Tubig-Francisco Elisa
Current Estimated Value
Purchase Details
Closed on
Jan 23, 2021
Sold by
Tubig Remiah and Tubig Rodolfo
Bought by
Tubig Remiah
Home Financials for this Owner
Home Financials are based on the most recent Mortgage that was taken out on this home.
Original Mortgage
$184,558
Interest Rate
3.05%
Mortgage Type
FHA
Purchase Details
Closed on
Oct 24, 2000
Sold by
Hartgens Janice
Bought by
Tubig Rodolfo and Tubig Remiah
Home Financials for this Owner
Home Financials are based on the most recent Mortgage that was taken out on this home.
Original Mortgage
$155,420
Interest Rate
7.83%
Mortgage Type
FHA
Purchase Details
Closed on
Jun 15, 1999
Sold by
Weaver Timothy
Bought by
Hartgens Janice
Home Financials for this Owner
Home Financials are based on the most recent Mortgage that was taken out on this home.
Original Mortgage
$140,980
Interest Rate
7.49%
Mortgage Type
FHA
Create a Home Valuation Report for This Property
The Home Valuation Report is an in-depth analysis detailing your home's value as well as a comparison with similar homes in the area
Home Values in the Area
Average Home Value in this Area
Purchase History
| Date | Buyer | Sale Price | Title Company |
|---|---|---|---|
| Tubig-Francisco Elisa | -- | Whiteman Brian L | |
| Tubig-Francisco Elisa | -- | None Listed On Document | |
| Tubig Remiah | -- | None Available | |
| Tubig Rodolfo | $160,000 | -- | |
| Hartgens Janice | $146,000 | -- |
Source: Public Records
Mortgage History
| Date | Status | Borrower | Loan Amount |
|---|---|---|---|
| Previous Owner | Tubig Remiah | $184,558 | |
| Previous Owner | Tubig Rodolfo | $155,420 | |
| Previous Owner | Hartgens Janice | $140,980 |
Source: Public Records
Tax History
| Year | Tax Paid | Tax Assessment Tax Assessment Total Assessment is a certain percentage of the fair market value that is determined by local assessors to be the total taxable value of land and additions on the property. | Land | Improvement |
|---|---|---|---|---|
| 2025 | $8,636 | $586,700 | $266,500 | $320,200 |
| 2024 | $8,138 | $493,200 | $225,500 | $267,700 |
| 2023 | $8,138 | $450,600 | $189,100 | $261,500 |
| 2022 | $6,774 | $425,000 | $168,800 | $256,200 |
| 2021 | $6,774 | $320,600 | $123,600 | $197,000 |
| 2020 | $6,572 | $310,300 | $123,600 | $186,700 |
| 2019 | $6,407 | $298,700 | $123,600 | $175,100 |
| 2018 | $6,454 | $297,400 | $123,600 | $173,800 |
| 2017 | $6,233 | $275,900 | $115,000 | $160,900 |
| 2016 | $6,494 | $286,700 | $115,000 | $171,700 |
| 2015 | $6,291 | $282,500 | $115,000 | $167,500 |
| 2014 | $6,293 | $232,300 | $105,000 | $127,300 |
Source: Public Records
Map
Nearby Homes
- 210 Cotter Ave
- 119 Harrow Ct
- 216 Maple Ave
- 608 Alpine Trail
- 304 Palmer Ave
- 208 Alpine Trail
- 608 Wayside Rd
- 5 Hogans Way
- 408 Alpine Trail Unit 408
- 2716 W Bangs Ave
- 2722 W Bangs Ave
- 1 Oak Dr
- 543 N Riverside Dr
- 124 Brighton Ave
- 30 Ash Dr
- 522 Woolley Dr
- 5 Oliver Dr
- 203 Neptune Blvd S
- 590 Bingham St
- 611 Bingham St
- 1015 Fordham Rd
- 1019 Fordham Rd
- 1016 Fordham Rd
- 1014 Fordham Rd
- 1018 Fordham Rd
- 1013 Fordham Rd
- 1021 Fordham Rd
- 1012 Fordham Rd
- 1017 Eton Way
- 1015 Eton Way
- 1019 Eton Way
- 1013 Eton Way
- 1011 Fordham Rd
- 1010 Fordham Rd
- 1023 Fordham Rd
- 107 Mansfield Ct
- 1011 Eton Way
- 105 Mansfield Ct
- 1008 Fordham Rd
- 1016 Eton Way
Your Personal Tour Guide
Ask me questions while you tour the home.