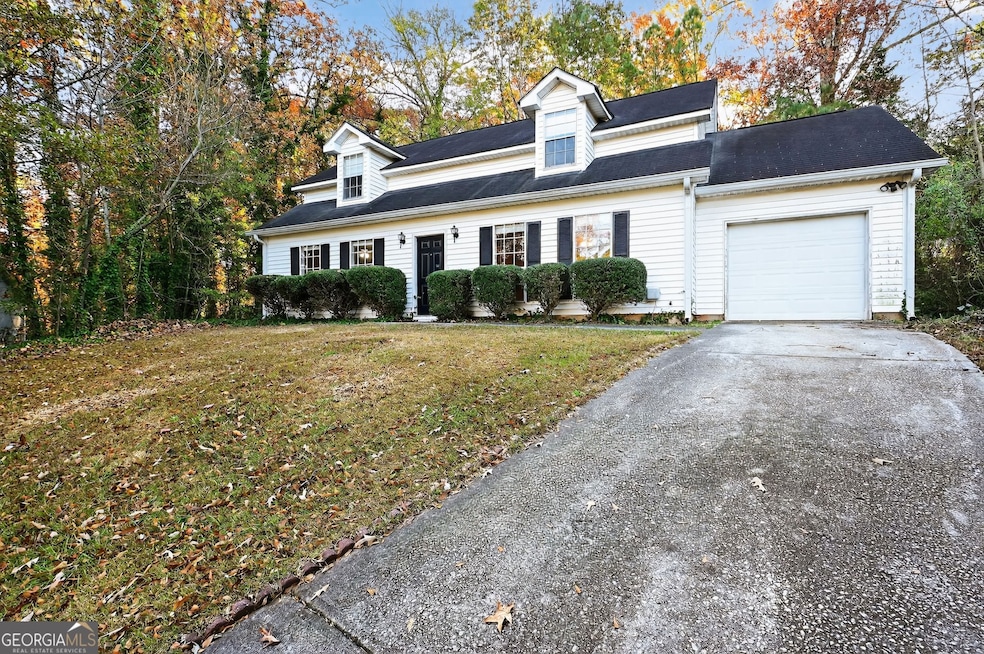
1017 Forest West Ct Stone Mountain, GA 30088
Estimated payment $1,367/month
Highlights
- Hot Property
- No HOA
- Formal Dining Room
- Traditional Architecture
- Breakfast Area or Nook
- Central Heating and Cooling System
About This Home
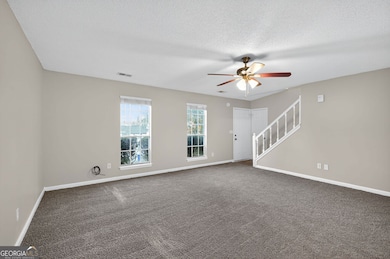
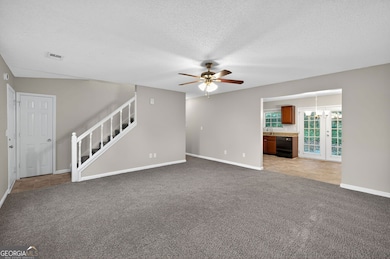
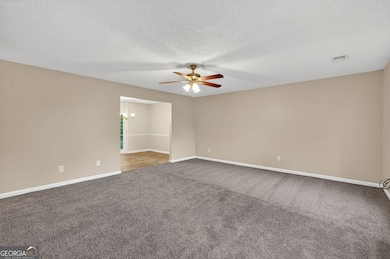
Beautiful 2 story home located in Stone Mountain GA with 4 bedrooms and 2 full baths. Features lots of natural light. Home to grow into. Main floor offers a formal dinning room, and separate living room. 2 bedrooms and full bath are located on the main floor and 2 more bedrooms upstairs. Home sits on 0.35 acres.
Home Details
Home Type
- Single Family
Est. Annual Taxes
- $4,464
Year Built
- Built in 1989
Lot Details
- 0.35 Acre Lot
- Sloped Lot
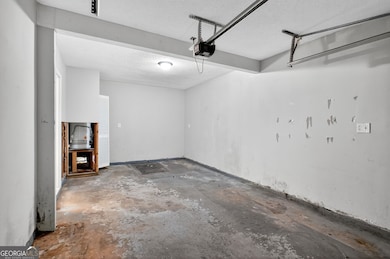
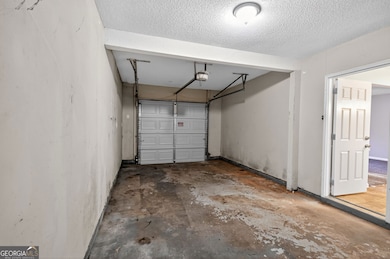
Parking
- 1 Car Garage
Home Design
- Traditional Architecture
- Slab Foundation
- Composition Roof
- Vinyl Siding
Interior Spaces
- 1,626 Sq Ft Home
- 2-Story Property
- Ceiling Fan
- Family Room
- Formal Dining Room
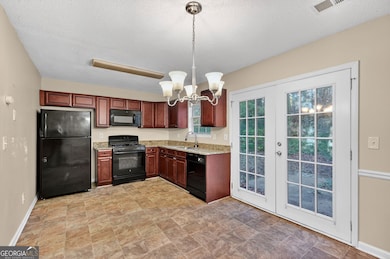
Kitchen
- Breakfast Area or Nook
- Oven or Range
- Microwave
- Dishwasher
Flooring
- Carpet
- Vinyl
Bedrooms and Bathrooms
Schools
- Shadow Rock Elementary School
- Redan Middle School
- Redan High School
Utilities
- Central Heating and Cooling System
Community Details
- No Home Owners Association
Map
Home Values in the Area
Average Home Value in this Area
Tax History
| Year | Tax Paid | Tax Assessment Tax Assessment Total Assessment is a certain percentage of the fair market value that is determined by local assessors to be the total taxable value of land and additions on the property. | Land | Improvement |
|---|---|---|---|---|
| 2025 | $4,464 | $92,440 | $20,337 | $72,103 |
| 2024 | $4,462 | $92,440 | $20,337 | $72,103 |
| 2023 | $4,462 | $92,440 | $20,000 | $72,440 |
| 2022 | $2,508 | $50,000 | $6,000 | $44,000 |
| 2021 | $3,164 | $64,960 | $6,000 | $58,960 |
| 2020 | $2,037 | $54,600 | $6,000 | $48,600 |
| 2019 | $2,037 | $39,280 | $6,000 | $33,280 |
| 2018 | $1,471 | $33,649 | $3,650 | $29,999 |
| 2017 | $1,992 | $38,080 | $4,240 | $33,840 |
| 2016 | $1,515 | $27,200 | $4,240 | $22,960 |
| 2014 | $329 | $9,000 | $4,240 | $4,760 |
Property History
| Date | Event | Price | List to Sale | Price per Sq Ft |
|---|---|---|---|---|
| 12/03/2025 12/03/25 | For Sale | $189,900 | -- | $117 / Sq Ft |
Purchase History
| Date | Type | Sale Price | Title Company |
|---|---|---|---|
| Quit Claim Deed | -- | -- | |
| Limited Warranty Deed | $11,569,148 | -- | |
| Warranty Deed | $47,000 | -- | |
| Foreclosure Deed | $43,680 | -- | |
| Deed | -- | -- |
Mortgage History
| Date | Status | Loan Amount | Loan Type |
|---|---|---|---|
| Previous Owner | $64,418,500 | Purchase Money Mortgage | |
| Previous Owner | $85,378 | FHA |
Source: Georgia MLS
MLS Number: 10652466
APN: 16-034-10-022
Disclaimer: Certain information contained herein is derived from information provided by parties other than Homes.com. All information provided is deemed reliable, but is not guaranteed to be accurate and should be independently verified.
![]() The data relating to real estate for sale on this web site comes in part from the Broker Reciprocity Program of Georgia MLS. Real estate listings held by brokerage firms other than Redfin are marked with the Broker Reciprocity logo and detailed information about them includes the name of the listing brokers. Information deemed reliable but not guaranteed. Copyright 2025 Georgia MLS. All rights reserved.
The data relating to real estate for sale on this web site comes in part from the Broker Reciprocity Program of Georgia MLS. Real estate listings held by brokerage firms other than Redfin are marked with the Broker Reciprocity logo and detailed information about them includes the name of the listing brokers. Information deemed reliable but not guaranteed. Copyright 2025 Georgia MLS. All rights reserved.
- 1045 Forest Path
- 1037 Forest Path Unit 3B
- 5340 Forest Place
- 1027 N Born Rd
- 5471 Fox Valley Ln Unit 10
- 1093 Panola Rd
- 5472 Forest East Ln
- 783 Fox Valley Dr
- 1040 Redan Trace
- 870 Chapman Cir
- 937 Fox Valley Ct
- 5661 Rutland Trace
- 1179 Panola Rd
- 884 Forest Path
- 915 Fox Valley Ct
- 5330 Tracey Dr
- 5435 Brandon Ct
- 5323 Tracey Dr
- 5526 Redan Rd
- 987 Fox Valley Trail
- 728 Fox Valley Dr
- 5349 Tracey Dr
- 834 Forest Path
- 5359 Kemper Place
- 5266 Long Green Ln Unit 2
- 5254 Long Green Ln
- 5561 George Rd
- 5230 Long Green Ln
- 5269 Long Green Ln
- 1269 Muirfield Dr
- 5225 Sweet Air Ln
- 1305 Panola Rd
- 855 Lost Creek Cir
- 1306 Muirforest Dr
- 832 Lost Creek Cir
- 749 Post Rd Ln
- 749 Post Road Ln
- 1401 Panola Rd
- 1407 Bridgewater Branch
