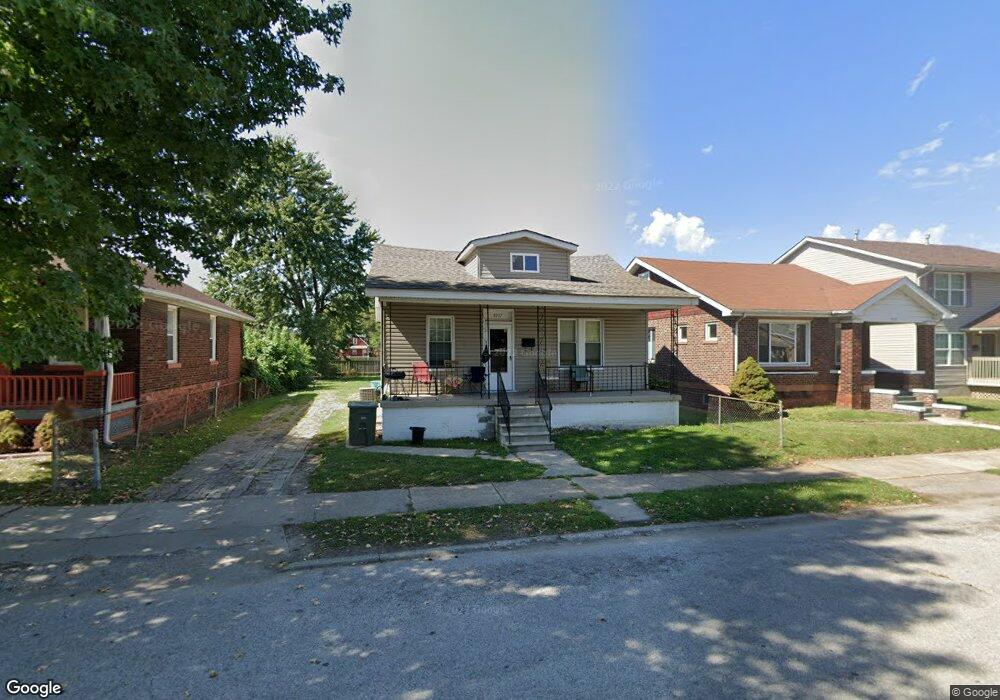
1017 Iowa St Madison, IL 62060
Estimated Value: $48,000 - $87,000
2
Beds
1
Bath
728
Sq Ft
$89/Sq Ft
Est. Value
About This Home
This home is located at 1017 Iowa St, Madison, IL 62060 and is currently estimated at $64,643, approximately $88 per square foot. 1017 Iowa St is a home located in Madison County with nearby schools including Bernard Long Elementary School, Madison Senior High School, and Rivers of Life Christian School.
Ownership History
Date
Name
Owned For
Owner Type
Purchase Details
Closed on
Sep 15, 2017
Sold by
Burrows Investments Llc
Bought by
Ryterski Sarah
Current Estimated Value
Purchase Details
Closed on
Apr 3, 2009
Sold by
Sfjv 2005 Llc
Bought by
Burrows Investments Llc
Purchase Details
Closed on
Feb 10, 2009
Sold by
Pointer Danielle P
Bought by
Sfjv 2005 Llc
Purchase Details
Closed on
Dec 15, 2003
Sold by
Thompson Christopher
Bought by
Pointer Danielle
Home Financials for this Owner
Home Financials are based on the most recent Mortgage that was taken out on this home.
Original Mortgage
$51,156
Interest Rate
6.03%
Mortgage Type
FHA
Purchase Details
Closed on
Jul 3, 2003
Sold by
Mottaz Steven N
Bought by
Thompson Christopher
Purchase Details
Closed on
Jun 27, 2003
Sold by
Morelan Lynn Marie
Bought by
Mottaz Steven N
Create a Home Valuation Report for This Property
The Home Valuation Report is an in-depth analysis detailing your home's value as well as a comparison with similar homes in the area
Home Values in the Area
Average Home Value in this Area
Purchase History
| Date | Buyer | Sale Price | Title Company |
|---|---|---|---|
| Ryterski Sarah | $25,500 | -- | |
| Burrows Investments Llc | $13,000 | Wheatland Title Guaranty | |
| Sfjv 2005 Llc | -- | None Available | |
| Pointer Danielle | $52,000 | -- | |
| Thompson Christopher | $12,000 | Community Title & Escrow | |
| Mottaz Steven N | -- | Community Title & Escrow |
Source: Public Records
Mortgage History
| Date | Status | Borrower | Loan Amount |
|---|---|---|---|
| Previous Owner | Pointer Danielle | $51,156 |
Source: Public Records
Tax History Compared to Growth
Tax History
| Year | Tax Paid | Tax Assessment Tax Assessment Total Assessment is a certain percentage of the fair market value that is determined by local assessors to be the total taxable value of land and additions on the property. | Land | Improvement |
|---|---|---|---|---|
| 2024 | $1,432 | $11,660 | $1,580 | $10,080 |
| 2023 | $1,432 | $10,210 | $1,380 | $8,830 |
| 2022 | $1,335 | $9,030 | $1,220 | $7,810 |
| 2021 | $1,237 | $8,510 | $1,150 | $7,360 |
| 2020 | $1,240 | $8,320 | $1,120 | $7,200 |
| 2019 | $1,251 | $8,470 | $1,140 | $7,330 |
| 2018 | $1,282 | $9,950 | $1,340 | $8,610 |
| 2017 | $1,337 | $10,050 | $1,350 | $8,700 |
| 2016 | $1,316 | $10,050 | $1,350 | $8,700 |
| 2015 | $1,269 | $9,730 | $1,300 | $8,430 |
| 2014 | $1,269 | $9,730 | $1,300 | $8,430 |
| 2013 | $1,269 | $9,850 | $1,320 | $8,530 |
Source: Public Records
Map
Nearby Homes
- 805 Iowa St
- - State St
- 1534 7th St
- 1821 Edwardsville Rd
- 1348 Madison Ave
- 2000 Meridian Ave
- 1610 5th St
- 1907 Rhodes St
- 025.001 McCambridge Ave
- 1720 5th St
- 1437 Grand Ave
- 1225 Douglas St
- 2013 4th St
- 305 Meredocia St
- 1832 Cleveland Blvd
- 2013 Grand Ave Unit A,B,A,B
- 1911 Benton St
- 2108 Washington Ave
- 623 Broadway
- 821 Niedringhaus Ave Unit A-D