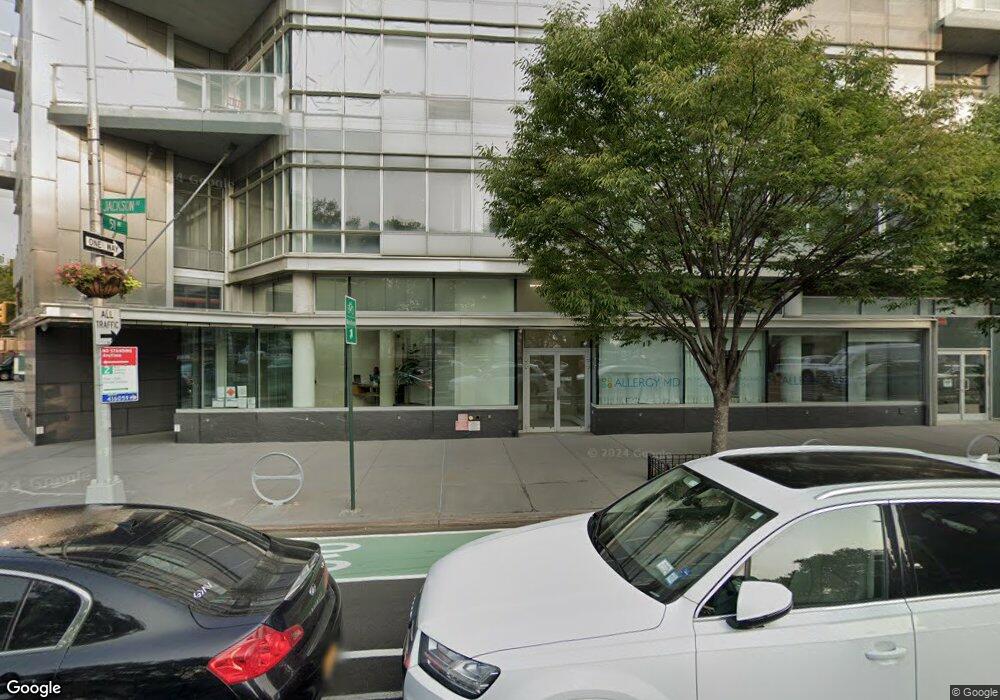
1017 Jackson Ave Unit 5F Long Island City, NY 11101
Hunters Point NeighborhoodEstimated Value: $700,363 - $793,000
--
Bed
--
Bath
576
Sq Ft
$1,315/Sq Ft
Est. Value
About This Home
This home is located at 1017 Jackson Ave Unit 5F, Long Island City, NY 11101 and is currently estimated at $757,591, approximately $1,315 per square foot. 1017 Jackson Ave Unit 5F is a home located in Queens County with nearby schools including P.S./I.S. 78Q Early Childhood Center, I.S. 204 Oliver W. Holmes, and Long Island City High School.
Ownership History
Date
Name
Owned For
Owner Type
Purchase Details
Closed on
Feb 6, 2023
Sold by
Yu Jocelyn Y L
Bought by
Mathew Maithreyi
Current Estimated Value
Home Financials for this Owner
Home Financials are based on the most recent Mortgage that was taken out on this home.
Original Mortgage
$475,000
Outstanding Balance
$459,439
Interest Rate
6.09%
Mortgage Type
Purchase Money Mortgage
Estimated Equity
$298,152
Purchase Details
Closed on
Oct 20, 2014
Sold by
Miguelez Xanamaria
Bought by
Yu Jocelyn Y L
Home Financials for this Owner
Home Financials are based on the most recent Mortgage that was taken out on this home.
Original Mortgage
$337,500
Interest Rate
4.18%
Mortgage Type
New Conventional
Purchase Details
Closed on
Jun 2, 2011
Sold by
Vernon Jackson Development Llc
Bought by
Miguelez Xanamaria
Home Financials for this Owner
Home Financials are based on the most recent Mortgage that was taken out on this home.
Original Mortgage
$385,000
Interest Rate
4.74%
Mortgage Type
Purchase Money Mortgage
Create a Home Valuation Report for This Property
The Home Valuation Report is an in-depth analysis detailing your home's value as well as a comparison with similar homes in the area
Home Values in the Area
Average Home Value in this Area
Purchase History
| Date | Buyer | Sale Price | Title Company |
|---|---|---|---|
| Mathew Maithreyi | $725,000 | -- | |
| Yu Jocelyn Y L | $675,000 | -- | |
| Miguelez Xanamaria | $515,000 | -- |
Source: Public Records
Mortgage History
| Date | Status | Borrower | Loan Amount |
|---|---|---|---|
| Open | Mathew Maithreyi | $475,000 | |
| Previous Owner | Yu Jocelyn Y L | $337,500 | |
| Previous Owner | Miguelez Xanamaria | $385,000 |
Source: Public Records
Tax History Compared to Growth
Tax History
| Year | Tax Paid | Tax Assessment Tax Assessment Total Assessment is a certain percentage of the fair market value that is determined by local assessors to be the total taxable value of land and additions on the property. | Land | Improvement |
|---|---|---|---|---|
| 2025 | $2,330 | $39,801 | $12,892 | $26,909 |
| 2024 | $2,330 | $38,741 | $12,892 | $25,849 |
| 2023 | $1,478 | $38,168 | $12,892 | $25,276 |
| 2022 | $641 | $35,968 | $12,892 | $23,076 |
| 2021 | $642 | $35,792 | $12,892 | $22,900 |
| 2020 | $653 | $38,566 | $12,892 | $25,674 |
| 2019 | $660 | $39,380 | $12,892 | $26,488 |
| 2018 | $666 | $30,436 | $12,898 | $17,538 |
| 2017 | $666 | $29,486 | $13,039 | $16,447 |
| 2016 | $675 | $29,486 | $13,039 | $16,447 |
| 2015 | $527 | $30,370 | $14,276 | $16,094 |
| 2014 | $527 | $29,857 | $13,617 | $16,240 |
Source: Public Records
Map
Nearby Homes
- 10-64 Jackson Ave Unit 4-B
- 5-27 51st Ave Unit PH-B
- 5-17 51st Ave
- 11-02 49th Ave Unit 8-A
- 11-02 49th Ave Unit PH-1C
- 11-02 49th Ave Unit 9-E
- 5-33 48th Ave Unit 4-G
- 206B Plan at Vesta
- 407B Plan at Vesta
- PH4A Plan at Vesta
- 405B Plan at Vesta
- 608B Plan at Vesta
- 207A Plan at Vesta
- 210B Plan at Vesta
- 311B Plan at Vesta
- 502A Plan at Vesta
- 204A Plan at Vesta
- 305B Plan at Vesta
- 301A Plan at Vesta
- 510B Plan at Vesta
- 1017 Jackson Ave
- 1017 Jackson Ave Unit 7I
- 1017 Jackson Ave Unit 5A
- 1017 Jackson Ave Unit 4B
- 1017 Jackson Ave Unit 6E
- 1017 Jackson Ave Unit 6B
- 1017 Jackson Ave Unit 6A
- 1017 Jackson Ave Unit 6D
- 1017 Jackson Ave Unit 3D
- 1017 Jackson Ave Unit 8I
- 1017 Jackson Ave Unit 2E
- 1017 Jackson Ave Unit 5E
- 1017 Jackson Ave Unit 5B
- 1017 Jackson Ave Unit 3F
- 1017 Jackson Ave Unit 4F
- 1017 Jackson Ave Unit 3B
- 1017 Jackson Ave Unit 3A
- 1017 Jackson Ave Unit 6C
- 1017 Jackson Ave Unit 5C
- 1017 Jackson Ave Unit 2A