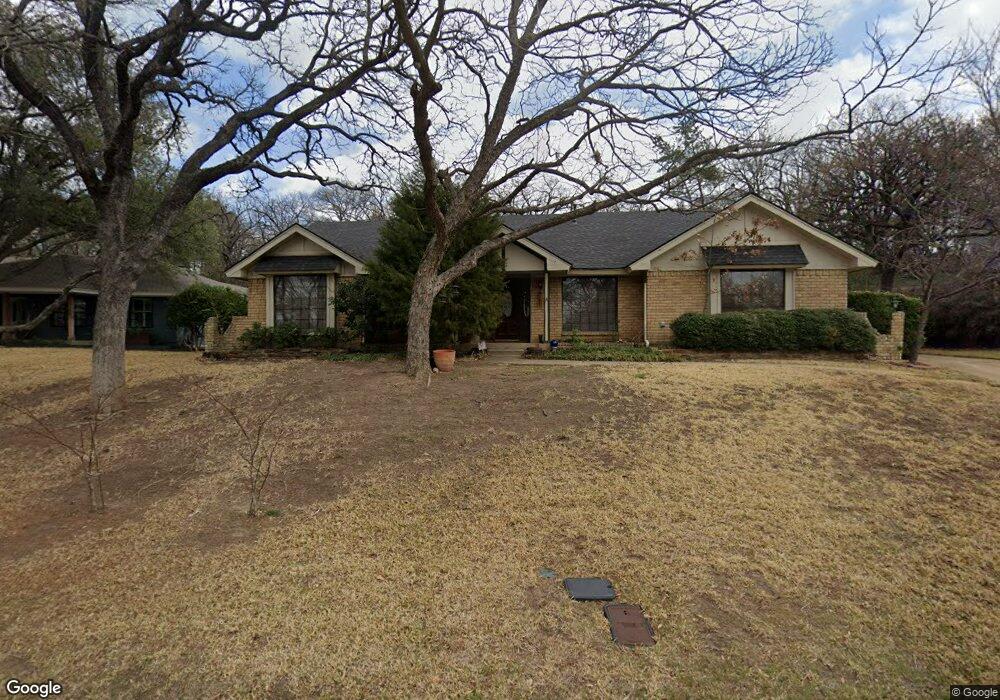
1017 Live Oak Ln Arlington, TX 76012
West Arlington NeighborhoodEstimated Value: $391,469 - $445,000
4
Beds
2
Baths
2,474
Sq Ft
$167/Sq Ft
Est. Value
About This Home
This home is located at 1017 Live Oak Ln, Arlington, TX 76012 and is currently estimated at $413,617, approximately $167 per square foot. 1017 Live Oak Ln is a home located in Tarrant County with nearby schools including Pope Elementary School, Shackelford J High School, and Lamar High School.
Ownership History
Date
Name
Owned For
Owner Type
Purchase Details
Closed on
Sep 21, 1998
Sold by
Sloboda Barbara A and Sloboda Miroslaw J
Bought by
Rowell Stanley C and Rowell Diane K
Current Estimated Value
Home Financials for this Owner
Home Financials are based on the most recent Mortgage that was taken out on this home.
Original Mortgage
$108,000
Outstanding Balance
$23,090
Interest Rate
6.91%
Estimated Equity
$390,527
Purchase Details
Closed on
Jul 23, 1996
Sold by
Ellis Stephen E and Ellis Nancy L
Bought by
Sloboda Miroslaw J and Sloboda Barbara A
Home Financials for this Owner
Home Financials are based on the most recent Mortgage that was taken out on this home.
Original Mortgage
$121,600
Interest Rate
8.41%
Create a Home Valuation Report for This Property
The Home Valuation Report is an in-depth analysis detailing your home's value as well as a comparison with similar homes in the area
Home Values in the Area
Average Home Value in this Area
Purchase History
| Date | Buyer | Sale Price | Title Company |
|---|---|---|---|
| Rowell Stanley C | -- | Alamo Title Co | |
| Sloboda Miroslaw J | -- | Trinity Western Title Co |
Source: Public Records
Mortgage History
| Date | Status | Borrower | Loan Amount |
|---|---|---|---|
| Open | Rowell Stanley C | $108,000 | |
| Previous Owner | Sloboda Miroslaw J | $121,600 | |
| Closed | Rowell Stanley C | $21,600 |
Source: Public Records
Tax History Compared to Growth
Tax History
| Year | Tax Paid | Tax Assessment Tax Assessment Total Assessment is a certain percentage of the fair market value that is determined by local assessors to be the total taxable value of land and additions on the property. | Land | Improvement |
|---|---|---|---|---|
| 2025 | $1,513 | $282,077 | $65,000 | $217,077 |
| 2024 | $1,513 | $282,077 | $65,000 | $217,077 |
| 2023 | $5,851 | $265,153 | $65,000 | $200,153 |
| 2022 | $6,093 | $258,859 | $65,000 | $193,859 |
| 2021 | $5,787 | $222,716 | $55,000 | $167,716 |
| 2020 | $6,198 | $246,788 | $55,000 | $191,788 |
| 2019 | $6,453 | $248,395 | $55,000 | $193,395 |
| 2018 | $3,188 | $240,568 | $30,000 | $210,568 |
| 2017 | $5,839 | $257,351 | $30,000 | $227,351 |
| 2016 | $5,308 | $211,990 | $30,000 | $181,990 |
| 2015 | $3,201 | $181,300 | $30,000 | $151,300 |
| 2014 | $3,201 | $181,300 | $30,000 | $151,300 |
Source: Public Records
Map
Nearby Homes
- 1104 Portofino Ct
- 1405 Blackhill Ct
- 1006 Portofino Dr
- 1005 Acorn Ct
- 905 Live Oak Ln
- 2804 Oak Cliff Ln
- 1420 Porto Bello Ct
- 900 Crowley Rd
- 809 Valley Oaks Ln
- 1103 Findlay Dr
- 1306 Riverview Dr
- 2308 Westwood Dr
- 3007 Sunray Valley Ct
- 2109 Greta Ln
- 606 Setting Sun Ln
- 2304 Oak Forest Ct
- 2305 Oak Forest Ct
- 2213 Shadywood Ct
- 612 Rainbow Creek Ct
- 2301 Wood Cliff Ct
- 1015 Live Oak Ln
- 1019 Live Oak Ln
- 1004 Whispering Oak Ct
- 1006 Whispering Oak Ct
- 1002 Whispering Oak Ct
- 1016 Live Oak Ln
- 1014 Live Oak Ln
- 1011 Live Oak Ln
- 1021 Live Oak Ln
- 1018 Live Oak Ln
- 1012 Live Oak Ln
- 1000 Whispering Oak Ct
- 1008 Whispering Oak Ct
- 2708 Pin Oak Ln
- 1109 Loch Lomond Ct
- 2902 Lucern Ct
- 1111 Loch Lomond Ct
- 1009 Whispering Oak Ct
- 1009 Whispering Oak Ct
- 1005 Whispering Oak Ct