1017 Mount Zion Church Rd Thomasville, NC 27360
Estimated Value: $212,000 - $312,997
1
Bed
1
Bath
1,800
Sq Ft
$141/Sq Ft
Est. Value
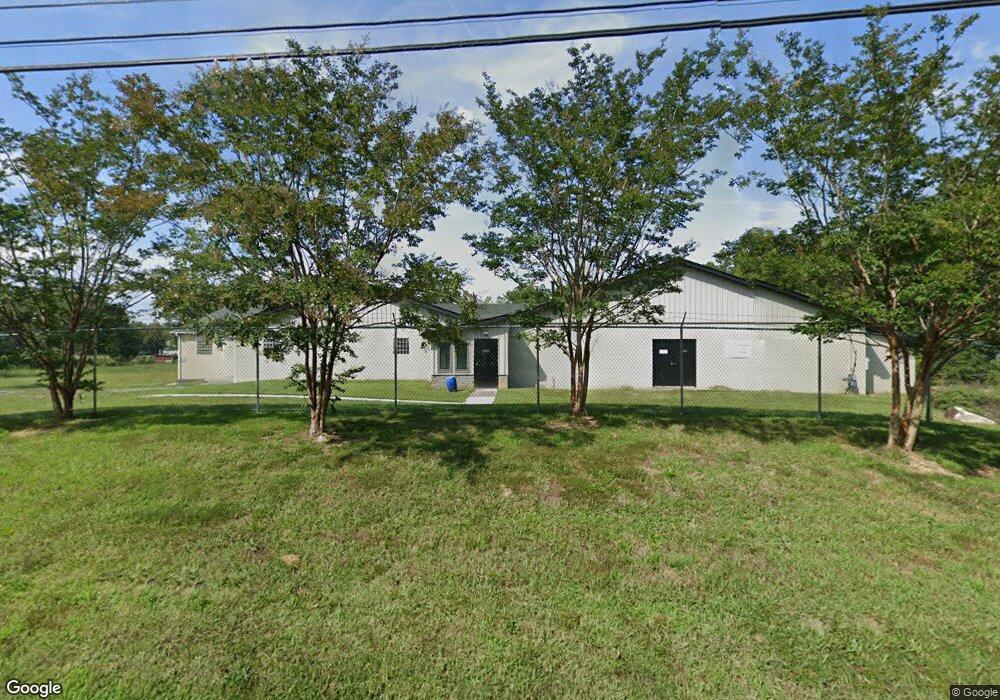
About This Home
This home is located at 1017 Mount Zion Church Rd, Thomasville, NC 27360 and is currently estimated at $253,999, approximately $141 per square foot. 1017 Mount Zion Church Rd is a home located in Davidson County with nearby schools including Brier Creek Elementary School, E. Lawson Brown Middle School, and East Davidson High School.
Ownership History
Date
Name
Owned For
Owner Type
Purchase Details
Closed on
Aug 29, 2014
Sold by
Johnson Eric W and Johnson Kimberly
Bought by
Tobin Jack L
Current Estimated Value
Home Financials for this Owner
Home Financials are based on the most recent Mortgage that was taken out on this home.
Original Mortgage
$45,000
Outstanding Balance
$33,282
Interest Rate
3.25%
Mortgage Type
Adjustable Rate Mortgage/ARM
Estimated Equity
$220,717
Purchase Details
Closed on
Jun 10, 2014
Sold by
Lincoln Trust Co
Bought by
Pensco Trust Co and Eddie C Brinkley Ira
Purchase Details
Closed on
Apr 13, 2012
Sold by
Johnson Frances T and Frances T Johnson Trust
Bought by
Johnson Frances T and Johnson Eric W
Purchase Details
Closed on
Aug 24, 2005
Sold by
Johnson Frances T
Bought by
Johnson Frances T and The Frances T Johnson Trust
Purchase Details
Closed on
Sep 1, 1984
Create a Home Valuation Report for This Property
The Home Valuation Report is an in-depth analysis detailing your home's value as well as a comparison with similar homes in the area
Home Values in the Area
Average Home Value in this Area
Purchase History
| Date | Buyer | Sale Price | Title Company |
|---|---|---|---|
| Tobin Jack L | $99,000 | None Available | |
| Pensco Trust Co | -- | None Available | |
| Johnson Frances T | $2,000 | None Available | |
| Johnson Frances T | -- | None Available | |
| -- | $39,000 | -- |
Source: Public Records
Mortgage History
| Date | Status | Borrower | Loan Amount |
|---|---|---|---|
| Open | Tobin Jack L | $45,000 |
Source: Public Records
Tax History Compared to Growth
Tax History
| Year | Tax Paid | Tax Assessment Tax Assessment Total Assessment is a certain percentage of the fair market value that is determined by local assessors to be the total taxable value of land and additions on the property. | Land | Improvement |
|---|---|---|---|---|
| 2025 | $1,435 | $227,620 | $0 | $0 |
| 2024 | $1,435 | $227,620 | $0 | $0 |
| 2023 | $1,435 | $227,620 | $0 | $0 |
| 2022 | $1,435 | $227,620 | $0 | $0 |
| 2021 | $1,435 | $227,620 | $0 | $0 |
| 2020 | $1,360 | $215,730 | $0 | $0 |
| 2019 | $1,381 | $215,730 | $0 | $0 |
| 2018 | $1,378 | $215,360 | $0 | $0 |
| 2017 | $1,378 | $215,360 | $0 | $0 |
| 2016 | $1,335 | $215,360 | $0 | $0 |
| 2015 | $1,335 | $215,360 | $0 | $0 |
| 2014 | $1,483 | $239,270 | $0 | $0 |
Source: Public Records
Map
Nearby Homes
- Lot 13/14 Hickory Trail
- 215 Fairfield Ct
- 298 Haven Hill Ln
- 240 Glendale Ave
- 337 Glendale Ave
- 179 Stephens Ln
- 3339 Kennedy Rd
- 8581 Us Highway 64 Hwy
- 855 Blackberry Rd
- 0 E US Highway 64
- 731 Pauls Airport Rd
- 104 Max Moore Rd
- 471 W Hunting Ridge Dr
- 283 Reid Rd
- 172 Cody Dr
- 1107 Harvest Dr
- 2257 Smith Farm Rd
- 2517 Denton Rd
- 808 John Black Rd
- 2501 Denton Rd
- 1024 Mount Zion Church Rd
- 1083 Mount Zion Church Rd
- 1000 Mount Zion Church Rd
- 969 Mount Zion Church Rd
- 1108 Mount Zion Church Rd
- 938 Mount Zion Church Rd
- 2 Hickory Trail
- 996 Mount Zion Church Rd
- 8 Hickory Trail
- 12 Hickory Trail
- 205 Barney Ln
- 892 Mount Zion Church Rd
- 3 Hickory Trail
- 867 Mount Zion Church Rd
- 7 Hickory Trail
- 18 Hickory Trail
- 854 Mount Zion Church Rd
- 837 Mount Zion Church Rd
- 1214 Mount Zion Church Rd
- 22 Hickory Trail