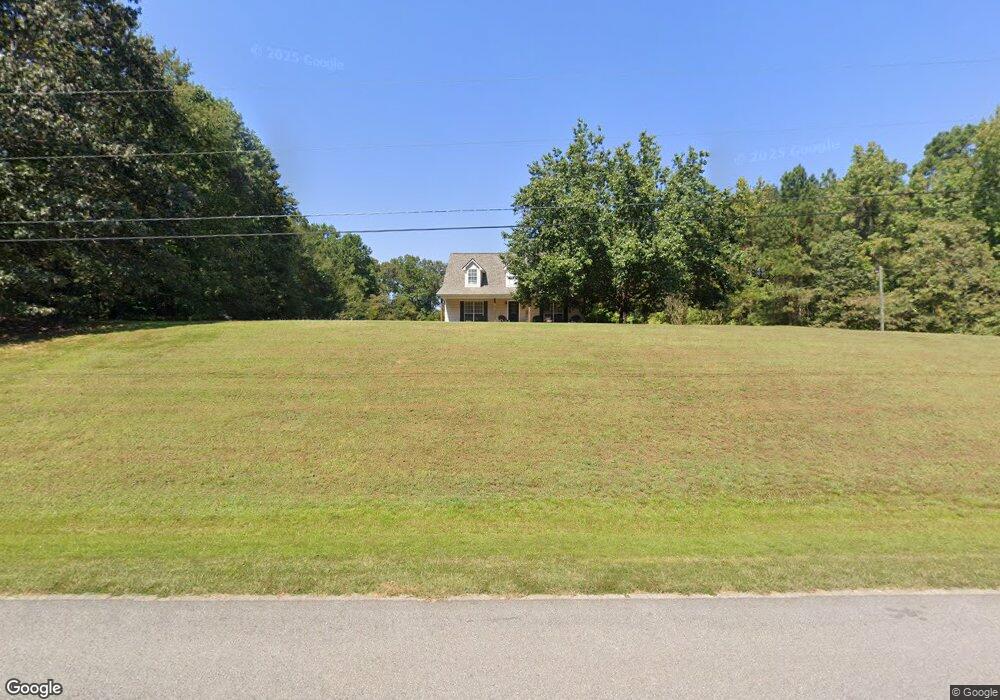
1017 S Bridge Rd Franklin, GA 30217
Estimated Value: $228,000 - $333,000
4
Beds
2
Baths
1,960
Sq Ft
$149/Sq Ft
Est. Value
About This Home
This home is located at 1017 S Bridge Rd, Franklin, GA 30217 and is currently estimated at $291,325, approximately $148 per square foot. 1017 S Bridge Rd is a home located in Heard County with nearby schools including Heard County High School.
Ownership History
Date
Name
Owned For
Owner Type
Purchase Details
Closed on
Sep 15, 2020
Sold by
Degraff Amanda
Bought by
Fowler Cody
Current Estimated Value
Purchase Details
Closed on
Sep 11, 2017
Bought by
Fowler Cody
Home Financials for this Owner
Home Financials are based on the most recent Mortgage that was taken out on this home.
Original Mortgage
$122,360
Interest Rate
3.9%
Mortgage Type
New Conventional
Purchase Details
Closed on
Nov 1, 2016
Sold by
Jason M
Bought by
Branch Banking & Trust Co
Purchase Details
Closed on
Jun 13, 2012
Sold by
Gray Scott Murray
Bought by
Rowland Jason M
Home Financials for this Owner
Home Financials are based on the most recent Mortgage that was taken out on this home.
Original Mortgage
$119,660
Interest Rate
3.75%
Mortgage Type
FHA
Purchase Details
Closed on
Oct 9, 2002
Sold by
Ward Regina
Bought by
Gray Scott Murray
Purchase Details
Closed on
Feb 2, 1998
Sold by
Jackson Andy
Bought by
Ward Regina
Create a Home Valuation Report for This Property
The Home Valuation Report is an in-depth analysis detailing your home's value as well as a comparison with similar homes in the area
Home Values in the Area
Average Home Value in this Area
Purchase History
| Date | Buyer | Sale Price | Title Company |
|---|---|---|---|
| Fowler Cody | -- | -- | |
| Fowler Cody | $128,800 | -- | |
| Branch Banking & Trust Co | $117,131 | -- | |
| Rowland Jason M | $124,000 | -- | |
| Gray Scott Murray | $135,000 | -- | |
| Ward Regina | $6,200 | -- |
Source: Public Records
Mortgage History
| Date | Status | Borrower | Loan Amount |
|---|---|---|---|
| Previous Owner | Fowler Cody | $122,360 | |
| Previous Owner | Rowland Jason M | $119,660 |
Source: Public Records
Tax History Compared to Growth
Tax History
| Year | Tax Paid | Tax Assessment Tax Assessment Total Assessment is a certain percentage of the fair market value that is determined by local assessors to be the total taxable value of land and additions on the property. | Land | Improvement |
|---|---|---|---|---|
| 2024 | $1,751 | $86,865 | $8,463 | $78,402 |
| 2023 | $1,568 | $75,115 | $7,053 | $68,062 |
| 2022 | $1,449 | $69,409 | $5,177 | $64,232 |
| 2021 | $1,200 | $54,625 | $5,177 | $49,448 |
| 2020 | $1,116 | $50,267 | $5,177 | $45,090 |
| 2019 | $1,116 | $50,267 | $5,177 | $45,090 |
| 2018 | $1,138 | $50,267 | $5,177 | $45,090 |
| 2017 | $1,083 | $47,945 | $3,946 | $43,999 |
| 2016 | $1,083 | $47,945 | $3,946 | $43,999 |
| 2015 | -- | $55,001 | $7,034 | $47,967 |
| 2014 | -- | $55,002 | $7,034 | $47,967 |
| 2013 | -- | $61,936 | $7,034 | $54,902 |
Source: Public Records
Map
Nearby Homes
- 1255 S Bridge Rd
- 262 Jackson Shoals Rd
- 0 Joe Cook Rd Unit 4 10550489
- 0 Joe Cook Rd Unit 3 10550484
- 0 Knight Dr
- 0 S Bridge Rd Unit 10615531
- 111 Nelson Rd
- LOT 4 Happy Hollow Rd
- LOT 3 Happy Hollow Rd
- LOT 2 Happy Hollow Rd
- 1676 Happy Hollow Rd
- 1600 Happy Hollow Rd
- 139 Nelson Rd
- 119 & 139 Nelson Rd
- 0000 Gray Rd
- 3899 Star Point Rd
- 0 Welcome Road Tract 3
- 359 Gray Rd
- 417 Gray Rd
- 10 Avery Rd
- S S Bridge Rd
- 889 S Bridge Rd
- 1101 S Bridge Rd
- 715 S Bridge Rd
- 0 Favor Rd Unit 7294524
- 1150 S Bridge Rd
- 25 Jackson Rd
- 1025 S Bridge Rd
- 69 Jackson Rd
- 1264 S Bridge Rd
- 1271 S Bridge Rd
- 610 S Bridge Rd
- 1363 S Bridge Rd
- 1031 S Bridge Rd Unit TRACT 3A
- 453 Favor Rd
- 282 Jackson Rd
- 1455 S Bridge Rd
- 428 S Bridge Rd
- 667 Favor Rd
- 1555 S Bridge Rd