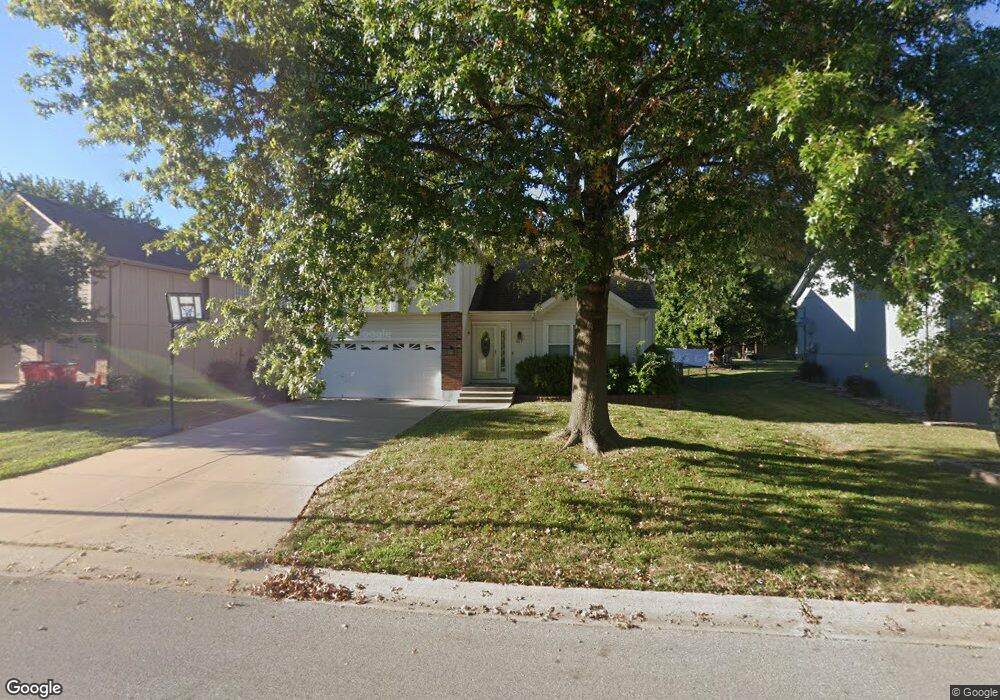
1017 SW Hillcrest Dr Blue Springs, MO 64015
Estimated Value: $318,000 - $362,000
3
Beds
2
Baths
1,730
Sq Ft
$195/Sq Ft
Est. Value
About This Home
This home is located at 1017 SW Hillcrest Dr, Blue Springs, MO 64015 and is currently estimated at $336,659, approximately $194 per square foot. 1017 SW Hillcrest Dr is a home located in Jackson County with nearby schools including Cordill-Mason Elementary School, Moreland Ridge Middle School, and Blue Springs South High School.
Ownership History
Date
Name
Owned For
Owner Type
Purchase Details
Closed on
Mar 3, 2023
Sold by
Decker Kirk D
Bought by
Selander-Decker Stephanie M
Current Estimated Value
Purchase Details
Closed on
Mar 25, 2002
Sold by
Mcdowell Robert A and Mcdowell Rebecca S
Bought by
Decker Kirk D and Decker Stephanie M
Home Financials for this Owner
Home Financials are based on the most recent Mortgage that was taken out on this home.
Original Mortgage
$155,447
Interest Rate
6.83%
Mortgage Type
FHA
Purchase Details
Closed on
Jun 3, 1997
Sold by
George T Ward Builders Inc
Bought by
Southgate Hills Home Assn
Purchase Details
Closed on
Oct 28, 1996
Sold by
Rustic Builders Inc
Bought by
Mcdowell Robert A and Mcdowell Rebecca S
Home Financials for this Owner
Home Financials are based on the most recent Mortgage that was taken out on this home.
Original Mortgage
$107,000
Interest Rate
8.31%
Mortgage Type
FHA
Create a Home Valuation Report for This Property
The Home Valuation Report is an in-depth analysis detailing your home's value as well as a comparison with similar homes in the area
Home Values in the Area
Average Home Value in this Area
Purchase History
| Date | Buyer | Sale Price | Title Company |
|---|---|---|---|
| Selander-Decker Stephanie M | -- | -- | |
| Decker Kirk D | -- | Security Land Title Company | |
| Southgate Hills Home Assn | -- | -- | |
| Mcdowell Robert A | -- | Security Land Title Company |
Source: Public Records
Mortgage History
| Date | Status | Borrower | Loan Amount |
|---|---|---|---|
| Previous Owner | Decker Kirk D | $155,447 | |
| Previous Owner | Mcdowell Robert A | $107,000 |
Source: Public Records
Tax History Compared to Growth
Tax History
| Year | Tax Paid | Tax Assessment Tax Assessment Total Assessment is a certain percentage of the fair market value that is determined by local assessors to be the total taxable value of land and additions on the property. | Land | Improvement |
|---|---|---|---|---|
| 2025 | $4,083 | $50,003 | $7,304 | $42,699 |
| 2024 | $4,001 | $51,110 | $7,049 | $44,061 |
| 2023 | $4,001 | $51,110 | $7,049 | $44,061 |
| 2022 | $3,365 | $37,810 | $4,997 | $32,813 |
| 2021 | $3,169 | $37,810 | $4,997 | $32,813 |
| 2020 | $2,993 | $34,282 | $4,997 | $29,285 |
| 2019 | $2,908 | $34,282 | $4,997 | $29,285 |
| 2018 | $916,762 | $31,367 | $4,365 | $27,002 |
| 2017 | $2,749 | $31,367 | $4,365 | $27,002 |
| 2016 | $2,723 | $31,179 | $4,807 | $26,372 |
| 2014 | $2,704 | $30,672 | $4,797 | $25,875 |
Source: Public Records
Map
Nearby Homes
- 1205 SW Southgate Dr
- 4716 SW 6th Terrace
- 4712 SW 6th Terrace
- 4000 SW 9th St
- 505 SW Newport Dr
- 509 SW Newport Dr
- 500 SW Chelmsford Dr
- 3908 SW 9th St
- 305 SW Nelson Dr
- 217 SW Chelmsford Dr
- 220 SW Chelmsford Dr
- The Magnolia Plan at Eagles Ridge - Garden Collection
- The Gardenia Plan at Eagles Ridge - Garden Collection
- Starlight Plan at Eagles Ridge
- Serenade Plan at Eagles Ridge - Bliss Collection
- Serenity Plan at Eagles Ridge - Bliss Collection
- Oasis Plan at Eagles Ridge - Bliss Collection
- Harmony Plan at Eagles Ridge - Bliss Collection
- Devotion Plan at Eagles Ridge - Bliss Collection
- Lexington Plan at Eagles Ridge - Premier Collection
- 1021 SW Hillcrest Dr
- 1013 SW Hillcrest Dr
- 1025 SW Hillcrest Dr
- 1012 SW Southgate Dr
- 1009 SW Hillcrest Dr
- 1012 SW Southgate Dr
- 1016 SW Hillcrest Dr
- 1016 SW Southgate Dr
- 1008 SW Southgate Dr
- 1029 SW Hillcrest Dr
- 1020 SW Southgate Dr
- 1024 SW Hillcrest Dr
- 1012 SW Hillcrest Dr
- 4604 SW 10th St
- 1005 SW Hillcrest Dr
- 1004 SW Southgate Dr
- 1100 SW Southgate Dr
- 1008 SW Hillcrest Dr
- 1033 SW Hillcrest Dr
- 1009 SW Southgate Dr