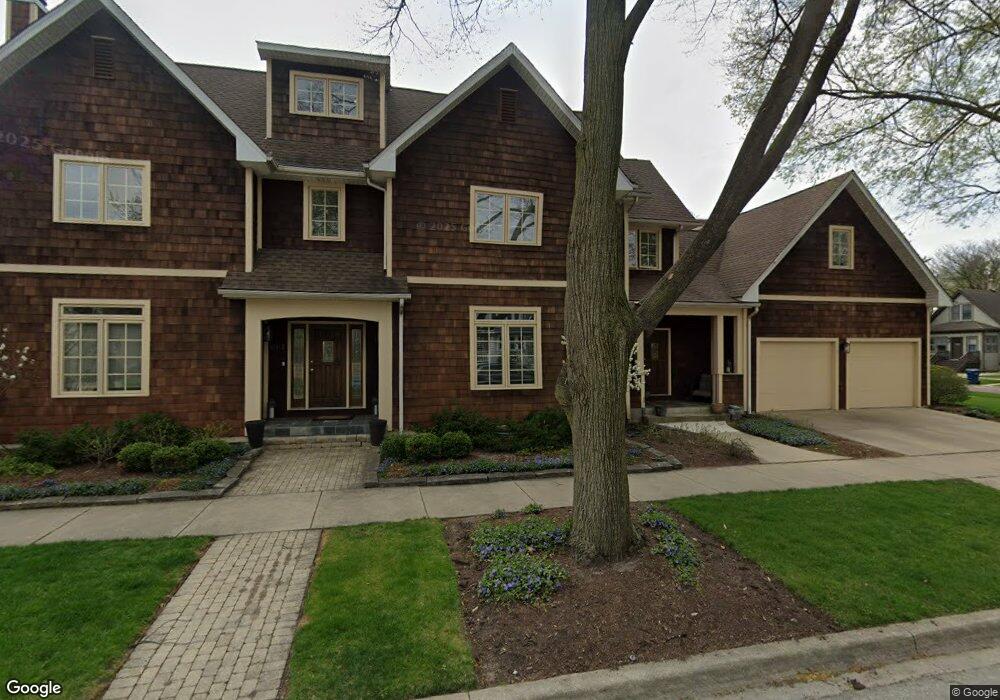
1017 Thomas St Oak Park, IL 60302
Estimated Value: $997,000 - $1,463,000
4
Beds
3
Baths
2,786
Sq Ft
$414/Sq Ft
Est. Value
About This Home
This home is located at 1017 Thomas St, Oak Park, IL 60302 and is currently estimated at $1,153,838, approximately $414 per square foot. 1017 Thomas St is a home located in Cook County with nearby schools including Horace Mann Elementary School, Percy Julian Middle School, and Oak Park and River Forest High School.
Ownership History
Date
Name
Owned For
Owner Type
Purchase Details
Closed on
Aug 11, 2017
Sold by
Mcclendon Fred W and Mcclendon Cathleen G
Bought by
Mcclendon Cathleen G and Mcclendon Fredric W
Current Estimated Value
Purchase Details
Closed on
Aug 27, 1998
Sold by
Jakovljevic Viktor and Goldstein Mitchell B
Bought by
Mcclendon Fred W and Mcclendon Cathleen G
Home Financials for this Owner
Home Financials are based on the most recent Mortgage that was taken out on this home.
Original Mortgage
$425,000
Interest Rate
6.96%
Purchase Details
Closed on
Mar 2, 1998
Sold by
Geary Carolyn Mostyn and Geary Thomas Walter
Bought by
Jakovlevic Victor and Goldstein Mitch
Home Financials for this Owner
Home Financials are based on the most recent Mortgage that was taken out on this home.
Original Mortgage
$292,800
Interest Rate
8.5%
Mortgage Type
Construction
Purchase Details
Closed on
Jun 21, 1995
Sold by
Mostyn Joan B
Bought by
Geary Carolyn Mostyn and Geary Thomas Walter
Create a Home Valuation Report for This Property
The Home Valuation Report is an in-depth analysis detailing your home's value as well as a comparison with similar homes in the area
Home Values in the Area
Average Home Value in this Area
Purchase History
| Date | Buyer | Sale Price | Title Company |
|---|---|---|---|
| Mcclendon Cathleen G | -- | None Available | |
| Mcclendon Fred W | $548,000 | -- | |
| Jakovlevic Victor | $135,000 | -- | |
| Geary Carolyn Mostyn | -- | -- |
Source: Public Records
Mortgage History
| Date | Status | Borrower | Loan Amount |
|---|---|---|---|
| Previous Owner | Mcclendon Fred W | $425,000 | |
| Previous Owner | Jakovlevic Victor | $292,800 |
Source: Public Records
Tax History Compared to Growth
Tax History
| Year | Tax Paid | Tax Assessment Tax Assessment Total Assessment is a certain percentage of the fair market value that is determined by local assessors to be the total taxable value of land and additions on the property. | Land | Improvement |
|---|---|---|---|---|
| 2024 | $25,826 | $82,536 | $14,725 | $67,811 |
| 2023 | $24,676 | $82,536 | $14,725 | $67,811 |
| 2022 | $24,676 | $67,683 | $12,743 | $54,940 |
| 2021 | $24,518 | $68,852 | $12,742 | $56,110 |
| 2020 | $24,948 | $71,443 | $12,742 | $58,701 |
| 2019 | $23,533 | $64,767 | $11,610 | $53,157 |
| 2018 | $22,648 | $64,767 | $11,610 | $53,157 |
| 2017 | $23,059 | $67,219 | $11,610 | $55,609 |
| 2016 | $22,257 | $57,797 | $9,627 | $48,170 |
| 2015 | $19,897 | $57,797 | $9,627 | $48,170 |
| 2014 | $18,507 | $57,797 | $9,627 | $48,170 |
| 2013 | $19,006 | $61,030 | $9,627 | $51,403 |
Source: Public Records
Map
Nearby Homes
- 810 N Marion St
- 742 N Marion St
- 801 N Marion St
- 1106 N Harlem Ave Unit 2
- 1000 N Harlem Ave
- 827 N Grove Ave
- 1129 Bonnie Brae Place Unit 1S
- 1037 Belleforte Ave
- 833 N Harlem Ave Unit 3S
- 820 N Oak Park Ave
- 1407 N Harlem Ave Unit C
- 1411 N Harlem Ave Unit A
- 1009 N Oak Park Ave
- 420 N Marion St
- 1030 Superior St
- 1038 Superior St Unit 1W
- 1143 Woodbine Ave
- 925 Linden Ave
- 7210 Oak Ave Unit 3SW
- 7200 Oak Ave Unit 3NW
- 740 Belleforte Ave Unit 1
- 740 Belleforte Ave Unit GARDEN
- 1011 Thomas St
- 734 Belleforte Ave
- 1010 Thomas St
- 1009 Thomas St
- 804 Belleforte Ave
- 1016 Thomas St
- 741 Forest Ave
- 739 Forest Ave
- 730 Belleforte Ave
- 801 Forest Ave
- 735 Forest Ave
- 810 Belleforte Ave
- 745 Forest Ave
- 747 Belleforte Ave
- 743 Belleforte Ave
- 805 Forest Ave
- 724 Belleforte Ave
- 731 Forest Ave