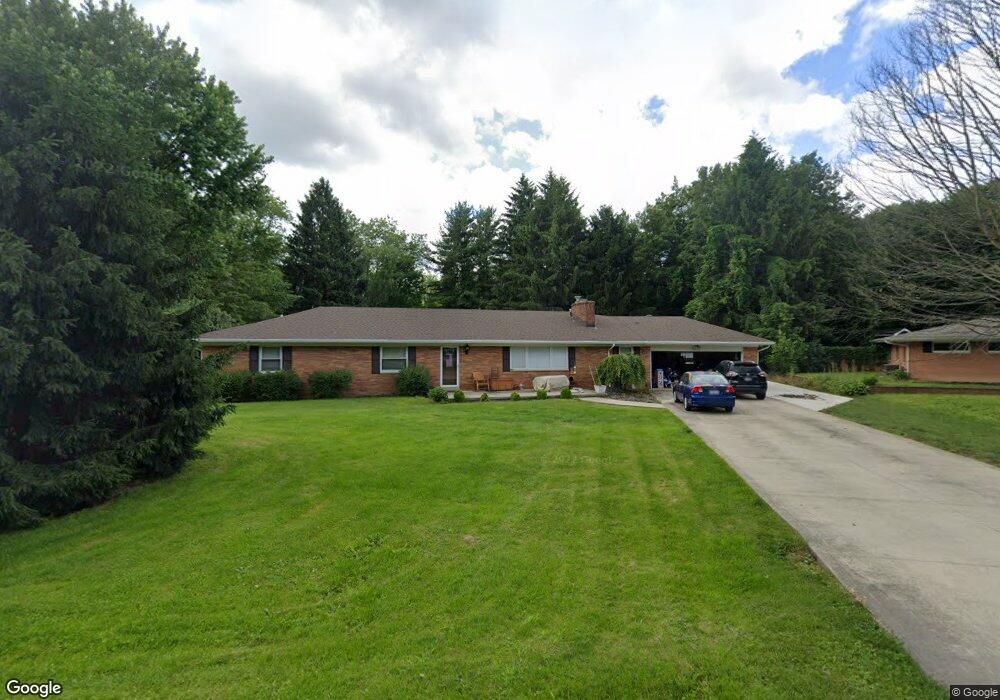
1017 Tralee Trail Beavercreek, OH 45430
Estimated Value: $312,000 - $368,000
4
Beds
2
Baths
2,073
Sq Ft
$159/Sq Ft
Est. Value
About This Home
This home is located at 1017 Tralee Trail, Beavercreek, OH 45430 and is currently estimated at $330,396, approximately $159 per square foot. 1017 Tralee Trail is a home located in Greene County with nearby schools including Valley Elementary School, Herman K Ankeney Middle School, and Beavercreek High School.
Ownership History
Date
Name
Owned For
Owner Type
Purchase Details
Closed on
Dec 12, 2018
Sold by
Creech Tara M
Bought by
Thorpe Justin E and Thorpe Kathleen E
Current Estimated Value
Home Financials for this Owner
Home Financials are based on the most recent Mortgage that was taken out on this home.
Original Mortgage
$227,905
Outstanding Balance
$200,789
Interest Rate
4.8%
Mortgage Type
Unknown
Estimated Equity
$129,607
Purchase Details
Closed on
Aug 1, 2012
Sold by
Hathaway Charlene Ann
Bought by
Creech Tara M
Purchase Details
Closed on
Jun 30, 1998
Sold by
Erwin Stanley J and Erwin Patricia F
Bought by
Hathaway Ronald C and Hathaway Charlene Ann
Home Financials for this Owner
Home Financials are based on the most recent Mortgage that was taken out on this home.
Original Mortgage
$127,250
Interest Rate
7.17%
Mortgage Type
VA
Purchase Details
Closed on
Oct 25, 1995
Sold by
Morrow James A
Bought by
Erwin Stanley J and Erwin F
Create a Home Valuation Report for This Property
The Home Valuation Report is an in-depth analysis detailing your home's value as well as a comparison with similar homes in the area
Home Values in the Area
Average Home Value in this Area
Purchase History
| Date | Buyer | Sale Price | Title Company |
|---|---|---|---|
| Thorpe Justin E | $239,900 | First American Title | |
| Creech Tara M | $120,000 | None Available | |
| Hathaway Ronald C | $132,000 | Ati Title Agency Of Ohio Inc | |
| Erwin Stanley J | $132,000 | -- |
Source: Public Records
Mortgage History
| Date | Status | Borrower | Loan Amount |
|---|---|---|---|
| Open | Thorpe Justin E | $227,905 | |
| Previous Owner | Hathaway Ronald C | $127,250 |
Source: Public Records
Tax History Compared to Growth
Tax History
| Year | Tax Paid | Tax Assessment Tax Assessment Total Assessment is a certain percentage of the fair market value that is determined by local assessors to be the total taxable value of land and additions on the property. | Land | Improvement |
|---|---|---|---|---|
| 2024 | $6,049 | $90,850 | $15,830 | $75,020 |
| 2023 | $6,049 | $90,850 | $15,830 | $75,020 |
| 2022 | $5,149 | $68,260 | $11,730 | $56,530 |
| 2021 | $5,048 | $68,260 | $11,730 | $56,530 |
| 2020 | $5,086 | $68,260 | $11,730 | $56,530 |
| 2019 | $4,239 | $51,950 | $8,400 | $43,550 |
| 2018 | $3,667 | $51,950 | $8,400 | $43,550 |
| 2017 | $3,605 | $51,950 | $8,400 | $43,550 |
| 2016 | $3,369 | $46,180 | $8,400 | $37,780 |
| 2015 | $3,258 | $44,950 | $8,400 | $36,550 |
| 2014 | $3,120 | $43,730 | $8,400 | $35,330 |
Source: Public Records
Map
Nearby Homes
- 1010 Renown Rd
- 4020 E Patterson Rd
- 3998 Willowcrest Rd
- 3667 Creekwood Ct
- 720 Talowood Dr
- 1285 Wallaby Dr
- 615 Bendwood Way
- 3917 E Summit Ridge Dr
- 3330 Fair Oaks Dr
- 3534 Sunset Bluff Dr
- 3392 Greenburn Rd Unit 3392
- 4174 White Hawk Ct
- 713 Newton Dr
- 3363 Maplewood Dr
- 3880 Southview Ave
- 684 Newton Dr
- 4235 Straight Arrow Rd
- 1617 N Central Dr
- 611 Cape Cod Ct
- 4274 Straight Arrow Rd Unit 4274
- 1013 Tralee Trail
- 1025 Tralee Trail
- 1030 Tralee Trail
- 1027 Tralee Trail
- 1011 Tralee Trail
- 1016 Woodhaven Place
- 997 Woodenbrook Ct
- 1030 Woodhaven Place
- 1040 Tralee Trail
- 1037 Tralee Trail
- 998 Woodenbrook Ct
- 1018 Tralee Trail
- 1009 Tralee Trail
- 991 Woodenbrook Ct
- 1005 Tralee Trail
- 1044 Stanwick Dr
- 1001 Woodhaven Place
- 1049 Tralee Trail
- 1052 Tralee Trail
- 1001 Tralee Trail