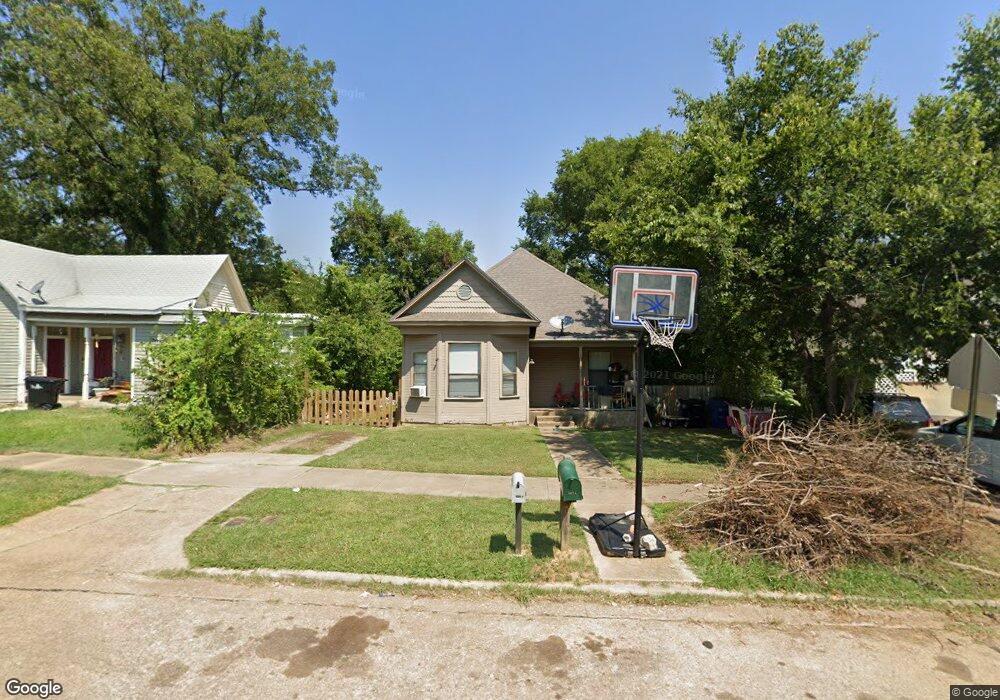
1017 W Morgan St Denison, TX 75020
Estimated Value: $165,000 - $195,858
3
Beds
2
Baths
1,737
Sq Ft
$104/Sq Ft
Est. Value
About This Home
This home is located at 1017 W Morgan St, Denison, TX 75020 and is currently estimated at $180,429, approximately $103 per square foot. 1017 W Morgan St is a home located in Grayson County with nearby schools including Houston Elementary School, Scott Middle School, and Denison High School.
Ownership History
Date
Name
Owned For
Owner Type
Purchase Details
Closed on
Aug 6, 2010
Sold by
Daniel Jim L and Daniel Christine A
Bought by
Clark George R and Clark Judith F
Current Estimated Value
Home Financials for this Owner
Home Financials are based on the most recent Mortgage that was taken out on this home.
Original Mortgage
$68,000
Outstanding Balance
$44,954
Interest Rate
4.54%
Mortgage Type
Purchase Money Mortgage
Estimated Equity
$135,475
Purchase Details
Closed on
Aug 4, 2008
Sold by
Clark George R and Clark Judith F
Bought by
Daniel Jim L and Daniel Christine A
Home Financials for this Owner
Home Financials are based on the most recent Mortgage that was taken out on this home.
Original Mortgage
$68,000
Interest Rate
6.4%
Mortgage Type
Seller Take Back
Create a Home Valuation Report for This Property
The Home Valuation Report is an in-depth analysis detailing your home's value as well as a comparison with similar homes in the area
Home Values in the Area
Average Home Value in this Area
Purchase History
| Date | Buyer | Sale Price | Title Company |
|---|---|---|---|
| Clark George R | -- | None Available | |
| Daniel Jim L | -- | Grayson County Title |
Source: Public Records
Mortgage History
| Date | Status | Borrower | Loan Amount |
|---|---|---|---|
| Open | Clark George R | $68,000 | |
| Previous Owner | Daniel Jim L | $68,000 |
Source: Public Records
Tax History Compared to Growth
Tax History
| Year | Tax Paid | Tax Assessment Tax Assessment Total Assessment is a certain percentage of the fair market value that is determined by local assessors to be the total taxable value of land and additions on the property. | Land | Improvement |
|---|---|---|---|---|
| 2025 | $4,525 | $188,354 | $51,000 | $137,354 |
| 2024 | $4,525 | $194,750 | $58,875 | $135,875 |
| 2023 | $3,577 | $157,886 | $39,000 | $118,886 |
| 2022 | $3,150 | $132,597 | $39,000 | $93,597 |
| 2021 | $2,344 | $92,921 | $19,950 | $72,971 |
| 2020 | $2,449 | $92,860 | $15,000 | $77,860 |
| 2019 | $2,432 | $88,398 | $8,550 | $79,848 |
| 2018 | $2,143 | $77,251 | $7,275 | $69,976 |
| 2017 | $1,770 | $63,256 | $3,000 | $60,256 |
| 2016 | $1,557 | $55,660 | $2,700 | $52,960 |
| 2015 | $1,587 | $56,170 | $3,150 | $53,020 |
| 2014 | $1,571 | $55,618 | $3,150 | $52,468 |
Source: Public Records
Map
Nearby Homes
- 920 W Morgan St
- 1127 W Morgan St
- 1120 W Owing St
- 831 W Owing St
- 904 W Shepherd St
- 1131 W Shepherd St
- 1027 W Crawford St
- 830 W Shepherd St
- 826 W Crawford St
- 919 W Day St
- 1109 W Crawford St
- 1217 W Nelson St
- 1224 W Nelson St
- 1223 W Owing St
- 501 S Eddy Ave
- 901 W Munson St
- 1221 W Crawford St
- 1319 W Morgan St
- 1109 S Chandler Ave
- TBD W Main St
- 1023 W Morgan St
- 1015 W Morgan St
- 1007 W Morgan St
- 1027 W Morgan St
- 1005 W Morgan St
- 1031 W Morgan St
- 1018 W Owing St
- 1012 W Owing St
- 1022 W Owing St
- 408 S Tone Ave
- 1006 W Owing St
- 1001 W Morgan St
- 1006 W Owings St
- 409 N Chandler Ave
- 400 S Tone Ave
- 407 S Chandler Ave
- 1016 W Morgan St
- 1014 W Morgan St
- 1022 W Morgan St
- 1026 W Morgan St