W
Landlord's Agent in 2025
Whitney Clay
Weichert, REALTORS(R)-BCS
(979) 997-0333
10 Total Sales

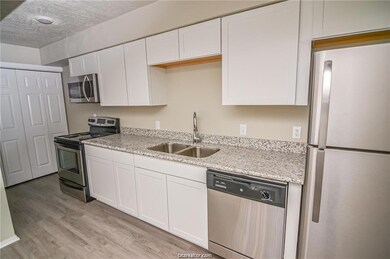
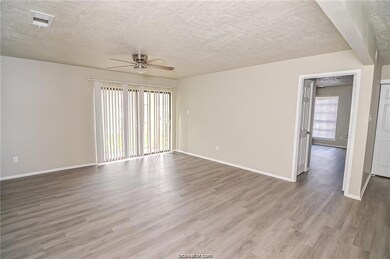


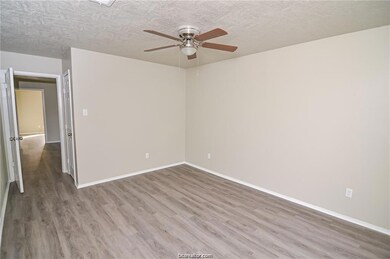
PRE-LEASING for AUGUST 2025. Unit has large bedrooms with restrooms attached and walk-in closets. Unit is renovated with granite counters, stainless steel appliances, new cabinets, and fresh paint. All appliances and water are included. Near the TAMU bus route and conveniently located off of University Dr.
Last Agent to Rent the Property
Weichert, REALTORS(R)-BCS License #0752426 Listed on: 01/07/2025

| Date | Buyer | Sale Price | Title Company |
|---|---|---|---|
| Rutland Benjamin | -- | Lawyers Title Co |
| Date | Status | Borrower | Loan Amount |
|---|---|---|---|
| Open | Rutland Benjamin | $225,000 |
| Date | Event | Price | List to Sale | Price per Sq Ft |
|---|---|---|---|---|
| 01/28/2025 01/28/25 | Rented | $1,000 | 0.0% | -- |
| 01/26/2025 01/26/25 | Under Contract | -- | -- | -- |
| 01/07/2025 01/07/25 | For Rent | $1,000 | +8.1% | -- |
| 05/21/2023 05/21/23 | Off Market | $925 | -- | -- |
| 02/18/2023 02/18/23 | Rented | $925 | 0.0% | -- |
| 02/11/2023 02/11/23 | Under Contract | -- | -- | -- |
| 01/25/2023 01/25/23 | For Rent | $925 | +2.8% | -- |
| 02/16/2022 02/16/22 | Rented | $900 | 0.0% | -- |
| 01/17/2022 01/17/22 | Under Contract | -- | -- | -- |
| 12/03/2021 12/03/21 | For Rent | $900 | 0.0% | -- |
| 06/04/2021 06/04/21 | Rented | $900 | 0.0% | -- |
| 05/05/2021 05/05/21 | Under Contract | -- | -- | -- |
| 03/15/2021 03/15/21 | For Rent | $900 | 0.0% | -- |
| 06/16/2020 06/16/20 | Rented | $900 | 0.0% | -- |
| 05/17/2020 05/17/20 | Under Contract | -- | -- | -- |
| 01/24/2020 01/24/20 | For Rent | $900 | -- | -- |
| Year | Tax Paid | Tax Assessment Tax Assessment Total Assessment is a certain percentage of the fair market value that is determined by local assessors to be the total taxable value of land and additions on the property. | Land | Improvement |
|---|---|---|---|---|
| 2025 | $7,751 | $495,874 | $62,000 | $433,874 |
| 2024 | $7,751 | $406,742 | $61,000 | $345,742 |
| 2023 | $7,751 | $468,154 | $60,500 | $407,654 |
| 2022 | $8,372 | $392,682 | $55,000 | $337,682 |
| 2021 | $7,004 | $310,080 | $55,000 | $255,080 |
| 2020 | $7,146 | $314,634 | $55,000 | $259,634 |
| 2019 | $6,116 | $258,820 | $55,000 | $203,820 |
| 2018 | $5,918 | $248,610 | $50,000 | $198,610 |
| 2017 | $6,007 | $255,220 | $50,000 | $205,220 |
| 2016 | $5,901 | $250,730 | $50,000 | $200,730 |
| 2015 | $5,230 | $248,950 | $50,000 | $198,950 |
| 2014 | $5,230 | $225,680 | $50,000 | $175,680 |
W
Landlord's Agent in 2025
Whitney Clay
Weichert, REALTORS(R)-BCS
(979) 997-0333
10 Total Sales
K
Buyer's Agent in 2023
Kelli Lowery
O'Hara & Company Real Estate
(281) 373-3393
36 Total Sales
Seller's Agent in 2020
Warren Green
Weichert, REALTORS(R)-BCS
(979) 574-1722
108 Total Sales
J
Buyer's Agent in 2020
Josh Jenkins
Brookhaven Realty
(979) 575-7559
99 Total Sales
Source: Bryan-College Station Regional Multiple Listing Service
MLS Number: 25000188
APN: 45640
Disclaimer: Certain information contained herein is derived from information provided by parties other than Homes.com. All information provided is deemed reliable, but is not guaranteed to be accurate and should be independently verified.
![]() IDX information is provided exclusively for personal, non-commercial use, and may not be used for any purpose other than to identify prospective properties consumers may be interested in purchasing.
IDX information is provided exclusively for personal, non-commercial use, and may not be used for any purpose other than to identify prospective properties consumers may be interested in purchasing.
Information is deemed reliable but not guaranteed.