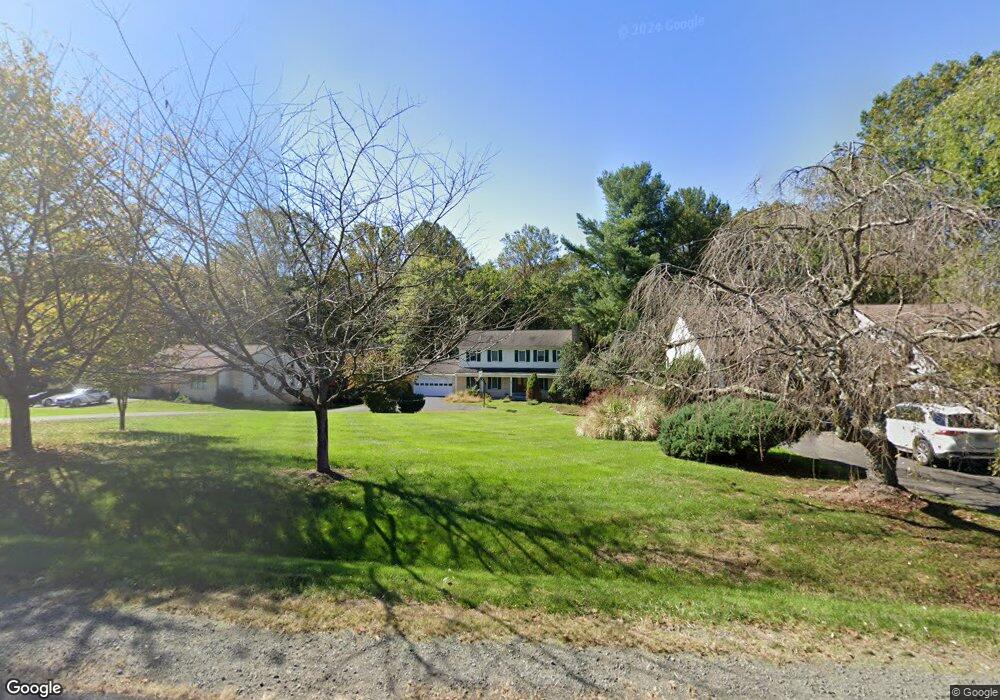
1018 Challedon Rd Great Falls, VA 22066
Estimated Value: $1,150,000 - $1,222,297
4
Beds
4
Baths
2,268
Sq Ft
$527/Sq Ft
Est. Value
About This Home
This home is located at 1018 Challedon Rd, Great Falls, VA 22066 and is currently estimated at $1,194,324, approximately $526 per square foot. 1018 Challedon Rd is a home located in Fairfax County with nearby schools including Colvin Run Elementary School, Cooper Middle School, and Langley High School.
Ownership History
Date
Name
Owned For
Owner Type
Purchase Details
Closed on
Oct 17, 2008
Sold by
Cartus Financial Corp
Bought by
Liu Chunmei and Shan,Min
Current Estimated Value
Home Financials for this Owner
Home Financials are based on the most recent Mortgage that was taken out on this home.
Original Mortgage
$417,000
Outstanding Balance
$261,112
Interest Rate
5.25%
Mortgage Type
New Conventional
Estimated Equity
$933,212
Purchase Details
Closed on
Aug 23, 2008
Sold by
Hwa and Chien Chuang Chien
Bought by
Cartus Financial Corp
Home Financials for this Owner
Home Financials are based on the most recent Mortgage that was taken out on this home.
Original Mortgage
$417,000
Outstanding Balance
$261,112
Interest Rate
5.25%
Mortgage Type
New Conventional
Estimated Equity
$933,212
Purchase Details
Closed on
Sep 30, 2004
Sold by
Crane Fredrick L
Bought by
Chien Hwa Chuang
Home Financials for this Owner
Home Financials are based on the most recent Mortgage that was taken out on this home.
Original Mortgage
$188,500
Interest Rate
5.81%
Mortgage Type
New Conventional
Create a Home Valuation Report for This Property
The Home Valuation Report is an in-depth analysis detailing your home's value as well as a comparison with similar homes in the area
Home Values in the Area
Average Home Value in this Area
Purchase History
| Date | Buyer | Sale Price | Title Company |
|---|---|---|---|
| Liu Chunmei | $707,000 | -- | |
| Cartus Financial Corp | $707,000 | -- | |
| Chien Hwa Chuang | $738,500 | -- |
Source: Public Records
Mortgage History
| Date | Status | Borrower | Loan Amount |
|---|---|---|---|
| Open | Liu Chunmei | $417,000 | |
| Closed | Liu Chunmei | $417,000 | |
| Previous Owner | Chien Hwa Chuang | $188,500 |
Source: Public Records
Tax History Compared to Growth
Tax History
| Year | Tax Paid | Tax Assessment Tax Assessment Total Assessment is a certain percentage of the fair market value that is determined by local assessors to be the total taxable value of land and additions on the property. | Land | Improvement |
|---|---|---|---|---|
| 2025 | $11,980 | $1,056,230 | $564,000 | $492,230 |
| 2024 | $11,980 | $1,034,060 | $549,000 | $485,060 |
| 2023 | $11,231 | $995,250 | $549,000 | $446,250 |
| 2022 | $10,165 | $888,980 | $494,000 | $394,980 |
| 2021 | $9,182 | $782,450 | $454,000 | $328,450 |
| 2020 | $8,848 | $747,590 | $449,000 | $298,590 |
| 2019 | $8,611 | $727,590 | $429,000 | $298,590 |
| 2018 | $8,473 | $736,820 | $429,000 | $307,820 |
| 2017 | $8,185 | $704,980 | $409,000 | $295,980 |
| 2016 | $8,167 | $704,980 | $409,000 | $295,980 |
| 2015 | $7,945 | $711,950 | $409,000 | $302,950 |
| 2014 | $7,820 | $702,260 | $406,000 | $296,260 |
Source: Public Records
Map
Nearby Homes
- 10332 Eclipse Ln
- 10518 Leesburg Pike
- 10600 Leesburg Pike
- 10602 Leesburg Pike
- 1140 Riva Ridge Dr
- 10505 Dunn Meadow Rd
- 1039 Harriman St
- 1002 Springvale Rd
- 903 Winstead St
- 10841 Welbury Ct
- 1305 Newkirk Ct
- 10801 Mason Hunt Ct
- 10907 Great Point Ct
- 1319 Gatesmeadow Way
- 1295 Colvin Forest Dr
- 829 Golden Arrow St
- 824 Constellation Dr
- 1000 Manning St
- 1332 Colvin Forest Dr
- 1398 Park Lake Dr
- 1016 Challedon Rd
- 1020 Challedon Rd
- 1022 Challedon Rd
- 1008 Challedon Rd
- 10503 Brevity Dr
- 1017 Challedon Rd
- 1007 Challedon Rd
- 1019 Challedon Rd
- 10416 Artemel Ln
- 1024 Challedon Rd
- 10414 Artemel Ln
- 1021 Challedon Rd
- 10406 Artemel Ln
- 1015 Challedon Rd
- 10412 Artemel Ln
- 1009 Challedon Rd
- 1005 Challedon Rd
- 10404 Artemel Ln
- 10402 Artemel Ln
- 1004 Challedon Rd