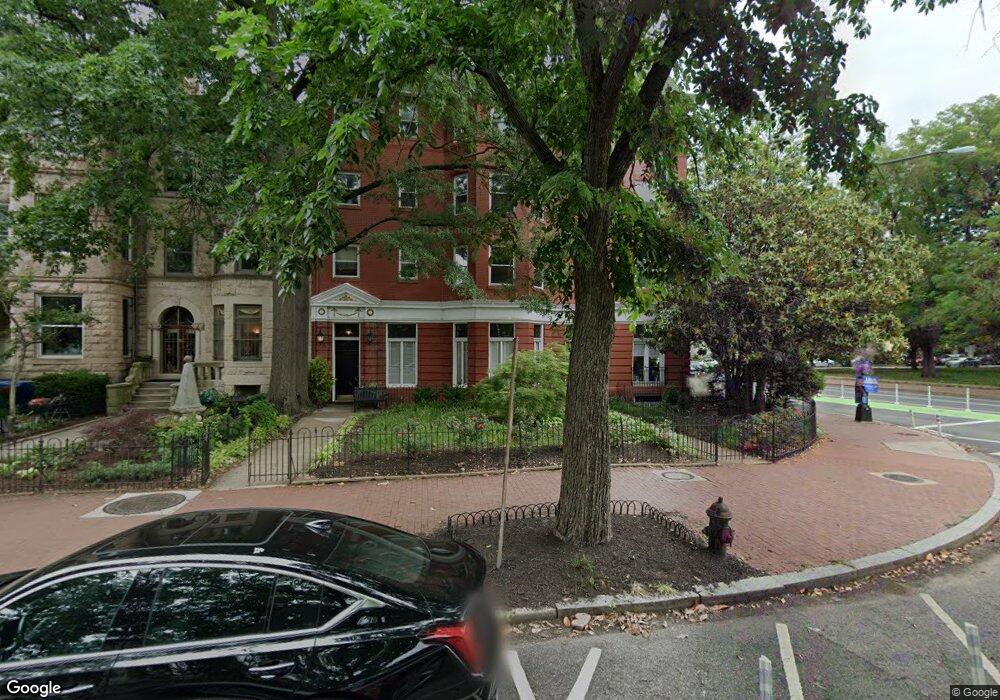
1018 E Capitol St NE Unit 1 Washington, DC 20003
Capitol Hill NeighborhoodEstimated Value: $786,000 - $1,004,000
2
Beds
2
Baths
1,304
Sq Ft
$696/Sq Ft
Est. Value
About This Home
This home is located at 1018 E Capitol St NE Unit 1, Washington, DC 20003 and is currently estimated at $907,542, approximately $695 per square foot. 1018 E Capitol St NE Unit 1 is a home located in District of Columbia with nearby schools including Maury Elementary School, Eliot-Hine Middle School, and Eastern High School.
Ownership History
Date
Name
Owned For
Owner Type
Purchase Details
Closed on
Aug 9, 2011
Sold by
Tillipman Jessica
Bought by
Robison Pauline M
Current Estimated Value
Home Financials for this Owner
Home Financials are based on the most recent Mortgage that was taken out on this home.
Original Mortgage
$542,400
Outstanding Balance
$373,155
Interest Rate
4.51%
Mortgage Type
New Conventional
Estimated Equity
$534,387
Purchase Details
Closed on
May 8, 2007
Sold by
Soby Michael
Bought by
Tillipman Jessica
Home Financials for this Owner
Home Financials are based on the most recent Mortgage that was taken out on this home.
Original Mortgage
$479,200
Interest Rate
6.27%
Mortgage Type
New Conventional
Purchase Details
Closed on
Dec 2, 2002
Sold by
Cornwell Trevor S
Bought by
Int'L Royal Lepage Reloc Svcs
Purchase Details
Closed on
Nov 27, 2000
Sold by
Carter John
Bought by
Cornwell Trevor
Home Financials for this Owner
Home Financials are based on the most recent Mortgage that was taken out on this home.
Original Mortgage
$254,150
Interest Rate
7.78%
Create a Home Valuation Report for This Property
The Home Valuation Report is an in-depth analysis detailing your home's value as well as a comparison with similar homes in the area
Home Values in the Area
Average Home Value in this Area
Purchase History
| Date | Buyer | Sale Price | Title Company |
|---|---|---|---|
| Robison Pauline M | $678,000 | -- | |
| Tillipman Jessica | $599,000 | -- | |
| Int'L Royal Lepage Reloc Svcs | $419,500 | -- | |
| Cornwell Trevor | $299,000 | -- |
Source: Public Records
Mortgage History
| Date | Status | Borrower | Loan Amount |
|---|---|---|---|
| Open | Robison Pauline M | $542,400 | |
| Previous Owner | Tillipman Jessica | $479,200 | |
| Previous Owner | Cornwell Trevor | $254,150 |
Source: Public Records
Tax History
| Year | Tax Paid | Tax Assessment Tax Assessment Total Assessment is a certain percentage of the fair market value that is determined by local assessors to be the total taxable value of land and additions on the property. | Land | Improvement |
|---|---|---|---|---|
| 2025 | $3,279 | $915,020 | $274,510 | $640,510 |
| 2024 | $6,746 | $895,840 | $268,750 | $627,090 |
| 2023 | $6,483 | $861,420 | $258,430 | $602,990 |
| 2022 | $6,389 | $844,090 | $253,230 | $590,860 |
| 2021 | $6,305 | $831,350 | $249,400 | $581,950 |
| 2020 | $6,093 | $869,980 | $260,990 | $608,990 |
| 2019 | $5,546 | $727,340 | $218,200 | $509,140 |
| 2017 | $5,154 | $678,810 | $0 | $0 |
| 2016 | $4,990 | $675,990 | $0 | $0 |
Source: Public Records
Map
Nearby Homes
- 131 11th St NE Unit 2
- 131 11th St NE Unit 1
- 131 11th St NE Unit 3
- 140 11th St NE
- 18 9th St NE Unit 305
- 18 9th St NE Unit 304
- 141 12th St NE Unit 15
- 811 Massachusetts Ave NE
- 10 8th St SE
- 812 N Carolina Ave SE
- 149 Kentucky Ave SE
- 1007 C St NE
- 213 9th St SE
- 1200 Walter St SE
- 235 12th St SE
- 237 8th St NE
- 901 D St NE Unit 207
- 21 Overbeck Aly NE
- 220 13th St SE Unit 24
- 712 C St NE
- 1018 E Capitol St NE Unit 8
- 1018 E Capitol St NE Unit 4
- 1018 E Capitol St NE Unit 9
- 1018 E Capitol St NE Unit 7
- 1018 E Capitol St NE Unit 6
- 1018 E Capitol St NE Unit 5
- 1018 E Capitol St NE Unit 3
- 1018 E Capitol St NE Unit 2
- 1020 E Capitol St NE Unit 2
- 1016 E Capitol St NE
- 1014 E Capitol St NE
- 1012 E Capitol St NE
- 1017 Massachusetts Ave NE
- 1010 E Capitol St NE
- 1015 Massachusetts Ave NE
- 1008 E Capitol St NE
- 1013 Massachusetts Ave NE
- 3 11th St SE
- 1006 E Capitol St NE
- 1011 Massachusetts Ave NE
Your Personal Tour Guide
Ask me questions while you tour the home.