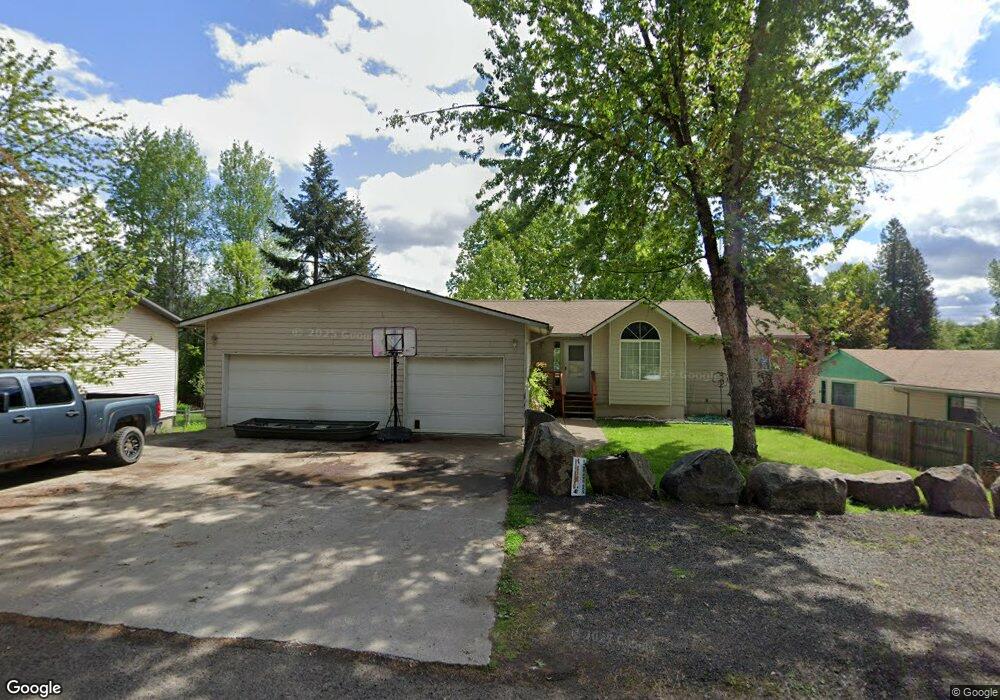
1018 Elm Dr Saint Maries, ID 83861
Estimated Value: $471,986 - $552,000
5
Beds
2
Baths
2,758
Sq Ft
$183/Sq Ft
Est. Value
About This Home
This home is located at 1018 Elm Dr, Saint Maries, ID 83861 and is currently estimated at $503,747, approximately $182 per square foot. 1018 Elm Dr is a home located in Benewah County with nearby schools including Heyburn Elementary School, UpRiver Elementary/Junior High School, and St. Maries Middle School.
Ownership History
Date
Name
Owned For
Owner Type
Purchase Details
Closed on
Oct 9, 2014
Sold by
Chase Heather M
Bought by
Hammons Jordan R and Hammons Ashley N
Current Estimated Value
Home Financials for this Owner
Home Financials are based on the most recent Mortgage that was taken out on this home.
Original Mortgage
$214,285
Outstanding Balance
$164,281
Interest Rate
4.1%
Mortgage Type
New Conventional
Estimated Equity
$339,466
Purchase Details
Closed on
Mar 4, 2005
Sold by
Flagor Anthony J and Flagor Tammy L
Bought by
Chase Bryan C and Chase Heather M
Home Financials for this Owner
Home Financials are based on the most recent Mortgage that was taken out on this home.
Original Mortgage
$194,750
Interest Rate
5.65%
Mortgage Type
New Conventional
Create a Home Valuation Report for This Property
The Home Valuation Report is an in-depth analysis detailing your home's value as well as a comparison with similar homes in the area
Home Values in the Area
Average Home Value in this Area
Purchase History
| Date | Buyer | Sale Price | Title Company |
|---|---|---|---|
| Hammons Jordan R | -- | First American Title | |
| Chase Heather M | -- | First American Title | |
| Chase Bryan C | -- | -- |
Source: Public Records
Mortgage History
| Date | Status | Borrower | Loan Amount |
|---|---|---|---|
| Open | Hammons Jordan R | $214,285 | |
| Previous Owner | Chase Bryan C | $194,750 |
Source: Public Records
Tax History Compared to Growth
Tax History
| Year | Tax Paid | Tax Assessment Tax Assessment Total Assessment is a certain percentage of the fair market value that is determined by local assessors to be the total taxable value of land and additions on the property. | Land | Improvement |
|---|---|---|---|---|
| 2025 | $32 | $480,578 | $50,000 | $430,578 |
| 2024 | $32 | $465,800 | $50,000 | $415,800 |
| 2023 | $3,064 | $442,822 | $55,000 | $387,822 |
| 2022 | $3,114 | $428,468 | $47,000 | $381,468 |
| 2021 | $2,497 | $290,862 | $34,000 | $256,862 |
| 2020 | $2,559 | $254,981 | $34,000 | $220,981 |
| 2019 | $2,574 | $255,963 | $34,000 | $221,963 |
| 2018 | $2,770 | $261,690 | $34,000 | $227,690 |
| 2017 | $2,216 | $215,330 | $27,000 | $188,330 |
| 2016 | $2,056 | $199,441 | $27,000 | $172,441 |
| 2015 | $2,244 | $205,570 | $27,000 | $178,570 |
| 2014 | -- | $203,378 | $27,000 | $176,378 |
| 2013 | -- | $207,040 | $27,000 | $180,040 |
Source: Public Records
Map
Nearby Homes
- 1119 Elm Dr
- 1009 S 2nd St
- NNA Fifth St
- 190 Ragan Dr
- NNA Ragan Dr
- 0 Larkspur Ln Unit 25-9627
- 346 S S 4th St
- 820 Plum Ln
- NNA First St
- 235 S 5th St
- 1002 Highland Ave
- 1161 Juniper Dr
- 1001 W Jefferson Ave
- 0 Ninth St
- 61 Pine St
- Nka Railroad Grade Rd
- 915 Main Ave
- 2353 St Marie Sriver Rd
- 32 Horn Hooked Ln
- 31 Horn Hooked Ln