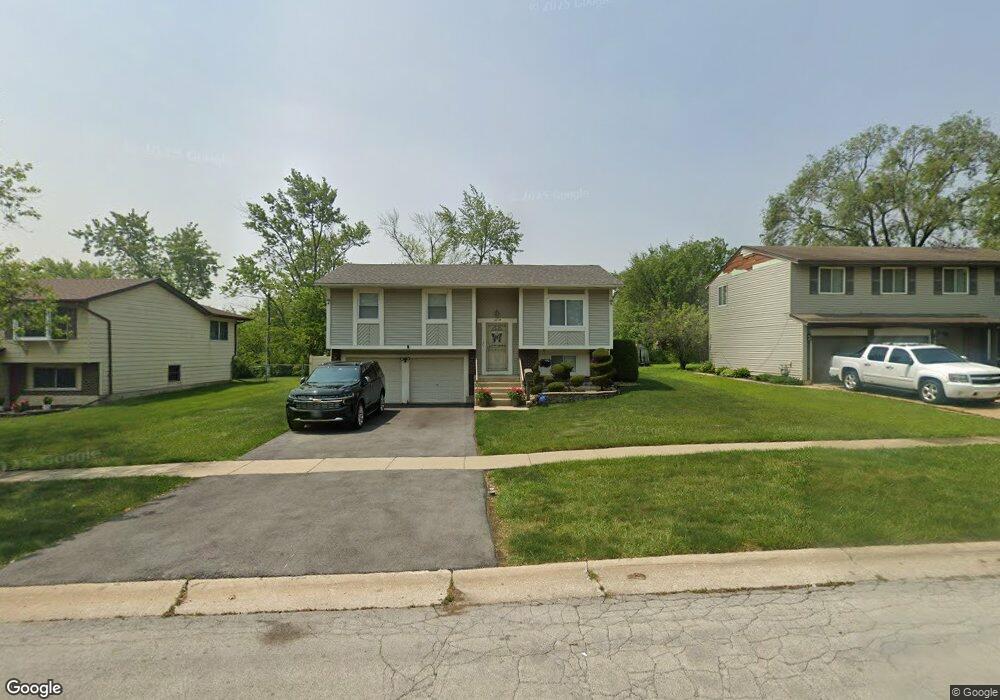
1018 Mildred Ln University Park, IL 60484
Estimated Value: $240,530 - $263,000
3
Beds
2
Baths
1,840
Sq Ft
$136/Sq Ft
Est. Value
About This Home
This home is located at 1018 Mildred Ln, University Park, IL 60484 and is currently estimated at $250,133, approximately $135 per square foot. 1018 Mildred Ln is a home located in Will County with nearby schools including Balmoral Elementary School, Crete-Monee Middle School, and Crete-Monee High School.
Ownership History
Date
Name
Owned For
Owner Type
Purchase Details
Closed on
Oct 1, 2004
Sold by
Sood Sue
Bought by
Anderson Jennifer
Current Estimated Value
Home Financials for this Owner
Home Financials are based on the most recent Mortgage that was taken out on this home.
Original Mortgage
$164,518
Outstanding Balance
$82,350
Interest Rate
5.93%
Mortgage Type
FHA
Estimated Equity
$167,783
Purchase Details
Closed on
Aug 7, 2003
Sold by
Standard Bank & Trust Co
Bought by
Sood Sue
Purchase Details
Closed on
Jun 27, 2003
Sold by
Wells Fargo Bank Minnesota Na
Bought by
Standard Bank & Trust Co and Trust #16560
Purchase Details
Closed on
Oct 1, 2002
Sold by
Ruckers James and New Century Mortgage
Bought by
Wells Fargo Bank Minnesota Na and Grp/Ag Reo 2000-1 Llc
Purchase Details
Closed on
May 10, 1997
Sold by
Stinson Barry
Bought by
Ruckers James
Create a Home Valuation Report for This Property
The Home Valuation Report is an in-depth analysis detailing your home's value as well as a comparison with similar homes in the area
Home Values in the Area
Average Home Value in this Area
Purchase History
| Date | Buyer | Sale Price | Title Company |
|---|---|---|---|
| Anderson Jennifer | $167,500 | Ticor Title | |
| Sood Sue | $155,000 | Ticor Title | |
| Standard Bank & Trust Co | $61,000 | Ticor Title | |
| Wells Fargo Bank Minnesota Na | -- | -- | |
| Ruckers James | -- | -- |
Source: Public Records
Mortgage History
| Date | Status | Borrower | Loan Amount |
|---|---|---|---|
| Open | Anderson Jennifer | $164,518 |
Source: Public Records
Tax History Compared to Growth
Tax History
| Year | Tax Paid | Tax Assessment Tax Assessment Total Assessment is a certain percentage of the fair market value that is determined by local assessors to be the total taxable value of land and additions on the property. | Land | Improvement |
|---|---|---|---|---|
| 2024 | $6,724 | $61,575 | $8,402 | $53,173 |
| 2023 | $6,724 | $53,082 | $7,243 | $45,839 |
| 2022 | $5,735 | $46,694 | $6,371 | $40,323 |
| 2021 | $5,091 | $42,519 | $5,852 | $36,667 |
| 2020 | $5,009 | $41,140 | $5,662 | $35,478 |
| 2019 | $5,029 | $39,013 | $5,369 | $33,644 |
| 2018 | $4,881 | $37,500 | $5,255 | $32,245 |
| 2017 | $5,043 | $35,811 | $5,138 | $30,673 |
| 2016 | $4,726 | $33,888 | $4,941 | $28,947 |
| 2015 | $4,007 | $30,940 | $4,503 | $26,437 |
| 2014 | $4,007 | $30,513 | $4,441 | $26,072 |
| 2013 | $4,007 | $31,950 | $4,650 | $27,300 |
Source: Public Records
Map
Nearby Homes
- 1039 Abbot Ln
- 1032 Samson Dr
- 1029 Samson Dr
- 543 Regent Rd
- 537 Nathan Rd
- 1109 Abbot Ln
- 1039 Barrow Ct
- 740 Mission St
- 903 Blackhawk Dr
- 607 Sullivan Ln
- 1031 Blackhawk Dr
- 815 Blackhawk Dr
- 608 Sullivan Ln
- 807 Blackhawk Dr
- 613 Farmview Rd
- 735 Union Dr
- 655 Sullivan Ln
- 1244 Harvest Ln
- 662 Sullivan Ln
- 610 Sandra Dr