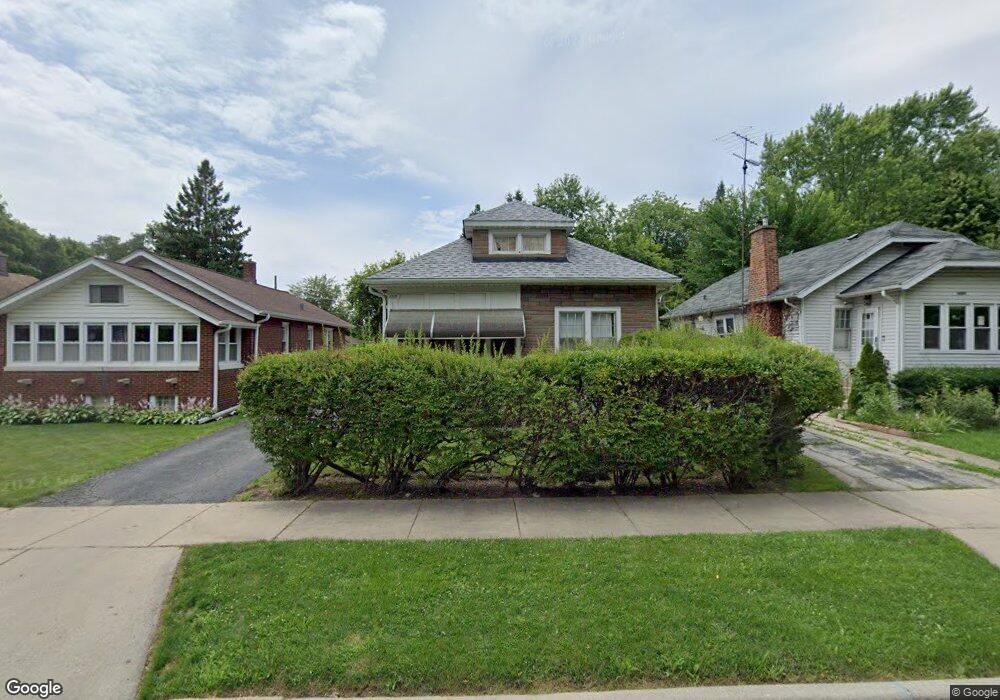
1018 N Poplar St Waukegan, IL 60085
Estimated Value: $186,000 - $248,000
3
Beds
1
Bath
1,152
Sq Ft
$189/Sq Ft
Est. Value
About This Home
This home is located at 1018 N Poplar St, Waukegan, IL 60085 and is currently estimated at $218,140, approximately $189 per square foot. 1018 N Poplar St is a home located in Lake County with nearby schools including Glen Flora Elementary School, Edith M Smith Middle School, and Waukegan High School.
Ownership History
Date
Name
Owned For
Owner Type
Purchase Details
Closed on
Aug 11, 2025
Sold by
Calderon Antonio and Hernandez Jesus Antonio
Bought by
Hernandez Elvia A Noyola
Current Estimated Value
Home Financials for this Owner
Home Financials are based on the most recent Mortgage that was taken out on this home.
Original Mortgage
$140,000
Outstanding Balance
$139,864
Interest Rate
6.13%
Mortgage Type
New Conventional
Estimated Equity
$78,276
Purchase Details
Closed on
Apr 2, 2021
Sold by
Hernandez Jesus Antonio and Calderon Antonio
Bought by
Hernandez Jesus Antonio and Calderon Antonio
Purchase Details
Closed on
Sep 23, 2009
Sold by
Saquic Pedro
Bought by
Calderon Antonio
Purchase Details
Closed on
Apr 24, 2002
Sold by
Calderon Antonio and Noyola Blanca
Bought by
Calderon Antonio and Saquic Pedro
Home Financials for this Owner
Home Financials are based on the most recent Mortgage that was taken out on this home.
Original Mortgage
$87,000
Interest Rate
6.87%
Purchase Details
Closed on
Jan 24, 1995
Sold by
Conroy Disa M
Bought by
Calderon Antonio and Noyola Blanca N
Home Financials for this Owner
Home Financials are based on the most recent Mortgage that was taken out on this home.
Original Mortgage
$79,718
Interest Rate
9.28%
Mortgage Type
FHA
Create a Home Valuation Report for This Property
The Home Valuation Report is an in-depth analysis detailing your home's value as well as a comparison with similar homes in the area
Home Values in the Area
Average Home Value in this Area
Purchase History
| Date | Buyer | Sale Price | Title Company |
|---|---|---|---|
| Hernandez Elvia A Noyola | $140,000 | Chicago Title | |
| Hernandez Jesus Antonio | -- | None Listed On Document | |
| Calderon Antonio | -- | None Available | |
| Calderon Antonio | -- | Ticor Title | |
| Calderon Antonio | $80,000 | -- |
Source: Public Records
Mortgage History
| Date | Status | Borrower | Loan Amount |
|---|---|---|---|
| Open | Hernandez Elvia A Noyola | $140,000 | |
| Previous Owner | Calderon Antonio | $87,000 | |
| Previous Owner | Calderon Antonio | $79,718 |
Source: Public Records
Tax History Compared to Growth
Tax History
| Year | Tax Paid | Tax Assessment Tax Assessment Total Assessment is a certain percentage of the fair market value that is determined by local assessors to be the total taxable value of land and additions on the property. | Land | Improvement |
|---|---|---|---|---|
| 2024 | $2,528 | $50,046 | $8,121 | $41,925 |
| 2023 | $2,528 | $44,806 | $7,271 | $37,535 |
| 2022 | $3,125 | $42,966 | $6,052 | $36,914 |
| 2021 | $3,375 | $38,374 | $5,399 | $32,975 |
| 2020 | $3,372 | $35,750 | $5,030 | $30,720 |
| 2019 | $3,341 | $32,759 | $4,609 | $28,150 |
| 2018 | $2,845 | $28,382 | $5,871 | $22,511 |
| 2017 | $2,718 | $25,110 | $5,194 | $19,916 |
| 2016 | $2,445 | $21,819 | $4,513 | $17,306 |
| 2015 | $2,285 | $19,528 | $4,039 | $15,489 |
| 2014 | $2,514 | $20,396 | $4,191 | $16,205 |
| 2012 | $3,335 | $22,097 | $4,541 | $17,556 |
Source: Public Records
Map
Nearby Homes
- 1110 N Ash St
- 918 N Ash St
- 917 N Linden Ave
- 1335 Chestnut St
- 1336 N Ash St
- 415 W Ridgeland Ave
- 1105 Woodlawn Cir
- 1109 Massena Ave
- 1312 N Linden Ave
- 620 N Poplar St
- 1000 Pine St
- 702 Franklin St
- 522 N Poplar St
- 325 4th St
- 824 N Butrick St
- 723 N County St
- 511 Chestnut St
- 428 N Poplar St
- 1504 W Glen Flora Ave
- 1018 W Atlantic Ave
- 1020 N Poplar St
- 1016 N Poplar St
- 1010 N Poplar St
- 1022 N Poplar St
- 1024 N Poplar St
- 1019 Chestnut St
- 1015 Chestnut St
- 1021 Chestnut St
- 1013 Chestnut St
- 1023 Chestnut St
- 706 W Ridgeland Ave
- 702 W Ridgeland Ave
- 1031 Chestnut St
- 710 W Ridgeland Ave
- 1017 N Poplar St
- 1019 N Poplar St
- 1015 N Poplar St
- 714 W Ridgeland Ave
- 1021 N Poplar St