Estimated Value: $631,936 - $686,000
3
Beds
3
Baths
2,446
Sq Ft
$269/Sq Ft
Est. Value
About This Home
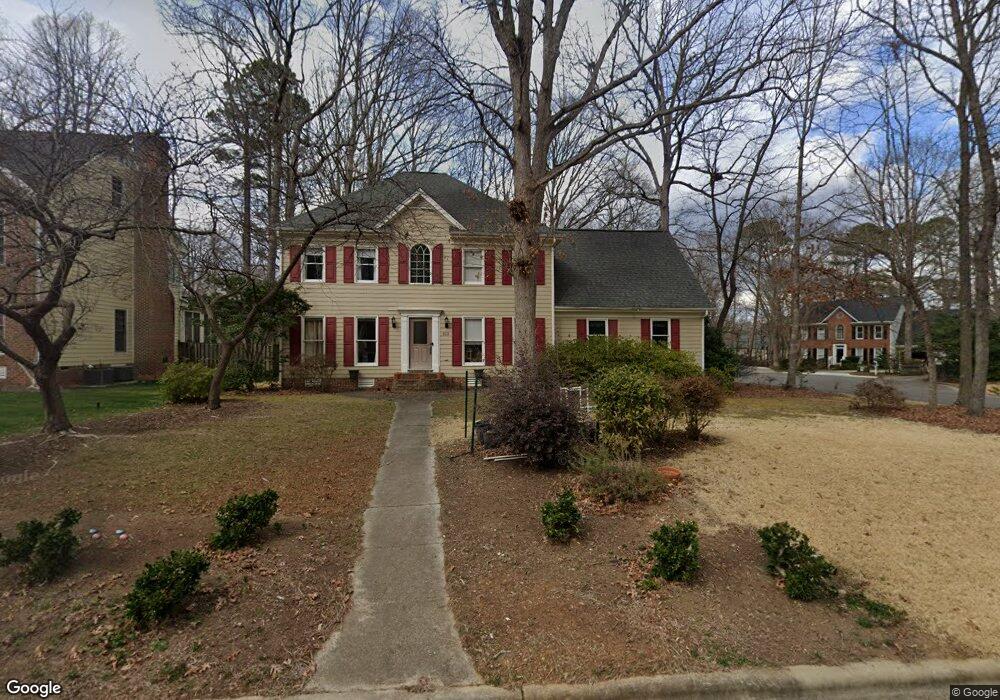
This home is located at 1018 New Dover Rd, Apex, NC 27502 and is currently estimated at $657,984, approximately $269 per square foot. 1018 New Dover Rd is a home located in Wake County with nearby schools including Apex Elementary School, Apex Middle, and Apex High School.
Ownership History
Date
Name
Owned For
Owner Type
Purchase Details
Closed on
Oct 29, 2009
Sold by
Schwaller Steven and Schwaller Lisa
Bought by
Strunk Corley and Strunk John
Current Estimated Value
Home Financials for this Owner
Home Financials are based on the most recent Mortgage that was taken out on this home.
Original Mortgage
$218,400
Outstanding Balance
$142,898
Interest Rate
5.04%
Mortgage Type
New Conventional
Estimated Equity
$515,086
Purchase Details
Closed on
Oct 31, 2007
Sold by
Myers Dennis E and Myers Joann K
Bought by
Schwaller Steven and Schwaller Lisa
Home Financials for this Owner
Home Financials are based on the most recent Mortgage that was taken out on this home.
Original Mortgage
$289,900
Interest Rate
6.27%
Mortgage Type
Purchase Money Mortgage
Create a Home Valuation Report for This Property
The Home Valuation Report is an in-depth analysis detailing your home's value as well as a comparison with similar homes in the area
Home Values in the Area
Average Home Value in this Area
Purchase History
| Date | Buyer | Sale Price | Title Company |
|---|---|---|---|
| Strunk Corley | $273,000 | None Available | |
| Schwaller Steven | $290,000 | None Available |
Source: Public Records
Mortgage History
| Date | Status | Borrower | Loan Amount |
|---|---|---|---|
| Open | Strunk Corley | $218,400 | |
| Previous Owner | Schwaller Steven | $289,900 |
Source: Public Records
Tax History Compared to Growth
Tax History
| Year | Tax Paid | Tax Assessment Tax Assessment Total Assessment is a certain percentage of the fair market value that is determined by local assessors to be the total taxable value of land and additions on the property. | Land | Improvement |
|---|---|---|---|---|
| 2025 | -- | $579,269 | $200,000 | $379,269 |
| 2024 | $4,964 | $579,269 | $200,000 | $379,269 |
| 2023 | $3,987 | $361,642 | $75,000 | $286,642 |
| 2022 | $3,743 | $361,642 | $75,000 | $286,642 |
| 2021 | $3,600 | $361,642 | $75,000 | $286,642 |
| 2020 | $3,564 | $361,642 | $75,000 | $286,642 |
| 2019 | $3,364 | $294,472 | $70,000 | $224,472 |
| 2018 | $3,169 | $294,472 | $70,000 | $224,472 |
| 2017 | $2,950 | $294,472 | $70,000 | $224,472 |
| 2016 | $2,907 | $294,472 | $70,000 | $224,472 |
| 2015 | -- | $290,806 | $66,000 | $224,806 |
| 2014 | -- | $290,806 | $66,000 | $224,806 |
Source: Public Records
Map
Nearby Homes
- 4006 New Yarmouth Way
- 1000 Oakgate Ct
- 903 Norwood Ln
- 635 Sawcut Ln
- 631 Sawcut Ln
- 633 Sawcut Ln
- 596 Grand Central Station
- 547 Grand Central Station
- 1002 Eastham Dr
- 1115 Platform Dr
- 1111 Platform Dr
- 295 Williams Grove Ln Unit Lot 67
- 285 Williams Grove Ln Unit Lot 65
- 281 Williams Grove Ln Unit Lot 64
- 281 Williams Grove Ln
- 298 Williams Grove Ln N Unit 68
- 294 Williams Grove Ln Unit 69
- 294 Williams Grove Ln
- 286 Williams Grove Ln Unit Lot 71
- 278 Williams Grove Ln Unit Lot 73
- 1020 New Dover Rd
- 2003 Charington Ct
- 1014 Chickering Ct
- 1022 New Dover Rd
- 1017 New Dover Rd
- 1019 New Dover Rd
- 3005 New Yarmouth Way
- 1015 New Dover Rd
- 2004 Charington Ct
- 2002 Charington Ct
- 3007 New Yarmouth Way
- 1021 New Dover Rd
- 3003 New Yarmouth Way
- 3009 New Yarmouth Way
- 1013 New Dover Rd
- 1024 New Dover Rd
- 1023 New Dover Rd
- 3011 New Yarmouth Way
- 3001 New Yarmouth Way
- 1011 New Dover Rd