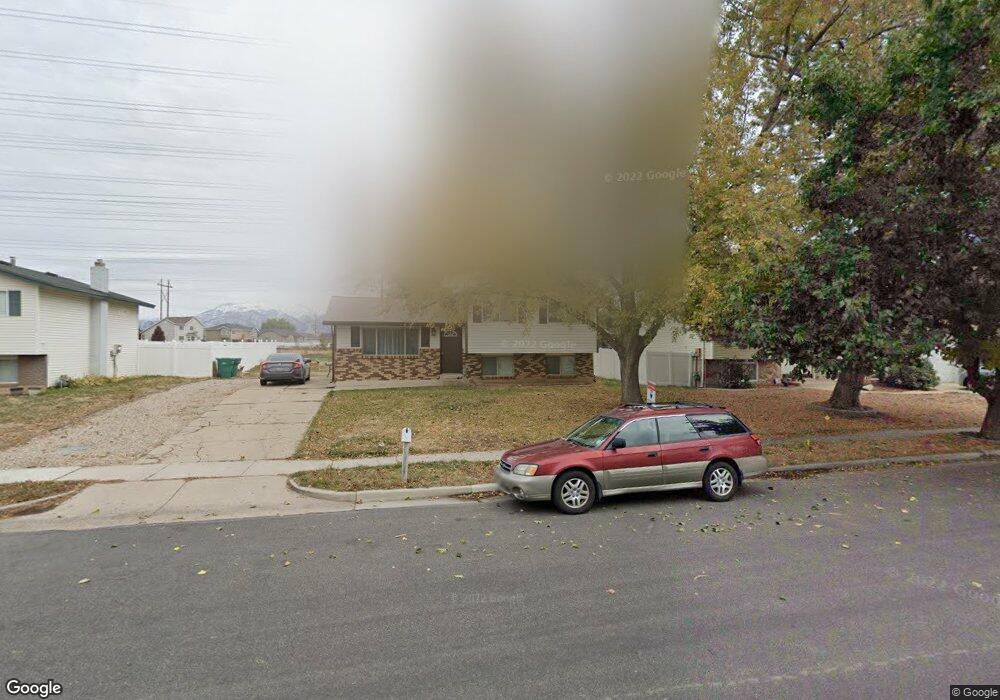
1018 S 1150 W Clearfield, UT 84015
Estimated Value: $404,000 - $424,000
4
Beds
2
Baths
1,856
Sq Ft
$223/Sq Ft
Est. Value
About This Home
This home is located at 1018 S 1150 W, Clearfield, UT 84015 and is currently estimated at $414,004, approximately $223 per square foot. 1018 S 1150 W is a home located in Davis County with nearby schools including Cook School, Syracuse Junior High School, and Syracuse High School.
Ownership History
Date
Name
Owned For
Owner Type
Purchase Details
Closed on
Apr 14, 2022
Sold by
Bruce Maddox
Bought by
Patina Esteban
Current Estimated Value
Purchase Details
Closed on
Feb 7, 2007
Sold by
Leavitt Mathew H and Leavitt Celinda O
Bought by
Maddox Bruce and Maddox Patsy
Home Financials for this Owner
Home Financials are based on the most recent Mortgage that was taken out on this home.
Original Mortgage
$119,800
Interest Rate
6.17%
Mortgage Type
Purchase Money Mortgage
Purchase Details
Closed on
Feb 6, 2007
Sold by
Maddox Patsy and Maddox Bruce
Bought by
Kilburn Hollie and Maddox Patsy
Home Financials for this Owner
Home Financials are based on the most recent Mortgage that was taken out on this home.
Original Mortgage
$119,800
Interest Rate
6.17%
Mortgage Type
Purchase Money Mortgage
Purchase Details
Closed on
May 2, 1996
Sold by
Leavitt Mathew H
Bought by
Leavitt Mathew H and Leavitt Celinda O
Create a Home Valuation Report for This Property
The Home Valuation Report is an in-depth analysis detailing your home's value as well as a comparison with similar homes in the area
Home Values in the Area
Average Home Value in this Area
Purchase History
| Date | Buyer | Sale Price | Title Company |
|---|---|---|---|
| Patina Esteban | -- | None Listed On Document | |
| Maddox Bruce | -- | Bonneville Superior Title Co | |
| Kilburn Hollie | -- | Accommodation | |
| Leavitt Mathew H | -- | -- |
Source: Public Records
Mortgage History
| Date | Status | Borrower | Loan Amount |
|---|---|---|---|
| Previous Owner | Maddox Bruce | $119,800 |
Source: Public Records
Tax History Compared to Growth
Tax History
| Year | Tax Paid | Tax Assessment Tax Assessment Total Assessment is a certain percentage of the fair market value that is determined by local assessors to be the total taxable value of land and additions on the property. | Land | Improvement |
|---|---|---|---|---|
| 2025 | $2,001 | $179,300 | $61,953 | $117,347 |
| 2024 | $1,943 | $175,449 | $59,225 | $116,224 |
| 2023 | $1,805 | $299,000 | $94,730 | $204,270 |
| 2022 | $1,878 | $168,300 | $54,210 | $114,090 |
| 2021 | $1,691 | $229,000 | $57,854 | $171,146 |
| 2020 | $1,473 | $198,000 | $48,695 | $149,305 |
| 2019 | $1,431 | $190,000 | $50,882 | $139,118 |
| 2018 | $1,291 | $167,000 | $45,163 | $121,837 |
| 2016 | $1,117 | $75,515 | $21,242 | $54,273 |
| 2015 | $1,071 | $69,025 | $21,242 | $47,783 |
| 2014 | $982 | $64,175 | $21,242 | $42,933 |
| 2013 | -- | $66,194 | $32,670 | $33,524 |
Source: Public Records
Map
Nearby Homes
- 1097 W 850 S
- 1166 Dallas St
- 817 S 1350 W
- 1121 W 1290 S
- 1385 S 1100 W
- 1384 S Melanie Ln
- 587 S 1400 W
- 1481 S Melanie Ln
- 1251 S 1650 W
- 1327 S 1650 W
- 1622 S 1000 W
- 922 S 1760 W
- 916 S 1760 W
- 1154 W 1700 S
- 4284 W 350 S Unit 615
- 4296 W 350 S Unit 614
- 1466 Earl Cir
- 1876 S 1230 W
- 1153 W 1875 S Unit 223
- 992 W 1910 S