Estimated Value: $212,766 - $225,000
--
Bed
2
Baths
1,620
Sq Ft
$136/Sq Ft
Est. Value
About This Home
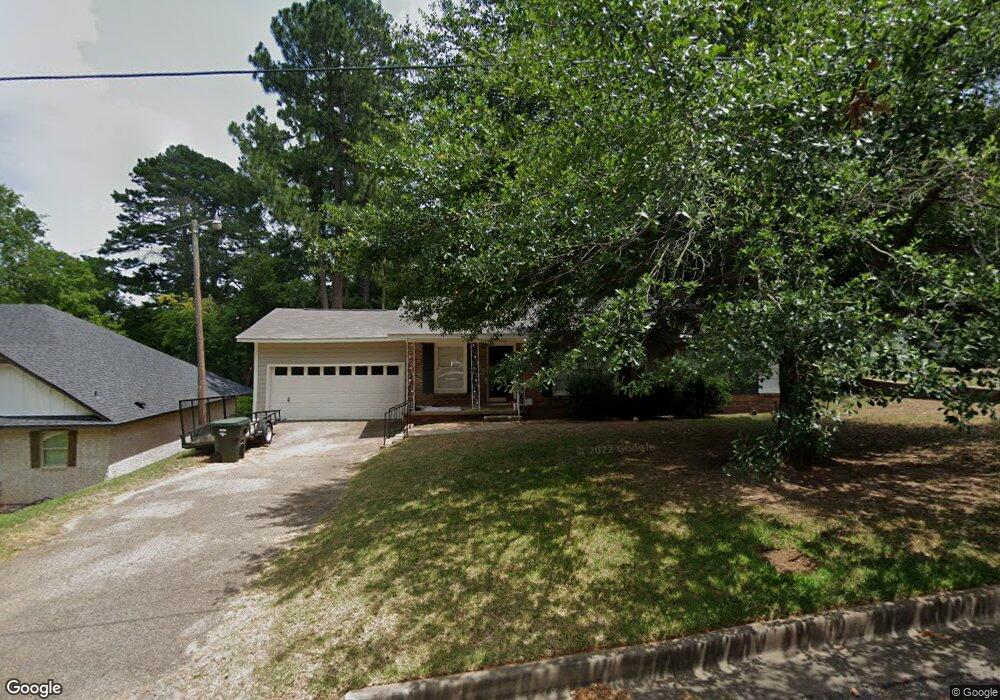
This home is located at 1018 S Azalea Dr, Tyler, TX 75701 and is currently estimated at $219,692, approximately $135 per square foot. 1018 S Azalea Dr is a home located in Smith County with nearby schools including Birdwell Dual Language Immersion School, Hogg Middle School, and Tyler Legacy High School.
Ownership History
Date
Name
Owned For
Owner Type
Purchase Details
Closed on
Oct 6, 2017
Sold by
Red Door Holdings Llc
Bought by
Sanders Brent D
Current Estimated Value
Home Financials for this Owner
Home Financials are based on the most recent Mortgage that was taken out on this home.
Original Mortgage
$78,800
Outstanding Balance
$54,002
Interest Rate
3.86%
Mortgage Type
Commercial
Estimated Equity
$165,690
Purchase Details
Closed on
Jul 14, 2008
Sold by
Ludovico Vicki
Bought by
Red Door Holdings Llc
Purchase Details
Closed on
Jul 16, 2007
Sold by
Funding Partners Lp
Bought by
Ludovico Vicki
Home Financials for this Owner
Home Financials are based on the most recent Mortgage that was taken out on this home.
Original Mortgage
$78,400
Interest Rate
6.54%
Mortgage Type
Purchase Money Mortgage
Create a Home Valuation Report for This Property
The Home Valuation Report is an in-depth analysis detailing your home's value as well as a comparison with similar homes in the area
Home Values in the Area
Average Home Value in this Area
Purchase History
| Date | Buyer | Sale Price | Title Company |
|---|---|---|---|
| Sanders Brent D | -- | None Available | |
| Red Door Holdings Llc | -- | None Available | |
| Ludovico Vicki | $78,400 | None Available | |
| Funding Partners Lp | -- | Fa |
Source: Public Records
Mortgage History
| Date | Status | Borrower | Loan Amount |
|---|---|---|---|
| Open | Sanders Brent D | $78,800 | |
| Previous Owner | Funding Partners Lp | $78,400 | |
| Closed | Ludovico Vicki | $0 |
Source: Public Records
Tax History Compared to Growth
Tax History
| Year | Tax Paid | Tax Assessment Tax Assessment Total Assessment is a certain percentage of the fair market value that is determined by local assessors to be the total taxable value of land and additions on the property. | Land | Improvement |
|---|---|---|---|---|
| 2025 | $3,220 | $199,446 | $31,863 | $167,583 |
| 2024 | $3,220 | $189,295 | $13,848 | $179,113 |
| 2023 | $2,750 | $157,746 | $13,848 | $143,898 |
| 2022 | $2,685 | $137,063 | $10,683 | $126,380 |
| 2021 | $2,582 | $123,082 | $10,683 | $112,399 |
| 2020 | $2,340 | $109,368 | $10,683 | $98,685 |
| 2019 | $2,161 | $98,804 | $8,870 | $89,934 |
| 2018 | $2,134 | $98,108 | $8,870 | $89,238 |
| 2017 | $2,095 | $98,108 | $8,870 | $89,238 |
| 2016 | $2,170 | $101,630 | $8,870 | $92,760 |
| 2015 | $2,009 | $97,700 | $8,870 | $88,830 |
| 2014 | $2,009 | $94,534 | $8,870 | $85,664 |
Source: Public Records
Map
Nearby Homes
- 2527 S Robertson Ave
- 2715 S Robertson Ave
- 2622 Oak Ln
- 1203 Dogwood St
- 2809 S Robertson Ave
- 1407 Dogwood St
- 1411 Dogwood St
- 1314 S Azalea Dr
- 829 W 10th St
- 902 W 9th St
- 2900 S Robertson Ave
- 2521 S Vine Ave
- 606 Tremont St
- 2525 S Vine Ave
- 2529 S Vine Ave
- 2864 S Robertson Ave
- 1425 Dogwood St
- 1209 Terre Haute Dr
- 2922 W Azalea Dr
- 0 Us Highway 271
- 1022 S Azalea Dr
- 1022 1022 S Azalea Dr
- 1012 S Azalea Dr
- 1026 1026 S Azalea
- 1026 S Azalea Dr
- 2537 S Robertson Ave
- 2435 Sunnybrook Dr
- 2441 Sunnybrook Dr
- 2441 2441 Sunnybrook
- 2447 Sunnybrook Dr
- 1020 Dogwood St
- 1028 1028 S Azalea
- 1028 S Azalea Dr
- 2451 Sunnybrook Dr
- 2607 S Robertson Ave
- 1028 Dogwood St
- 1030 S Azalea Dr
- 2415 Sunnybrook Dr
- 1100 S Azalea Dr
- 2532 S Robertson Ave