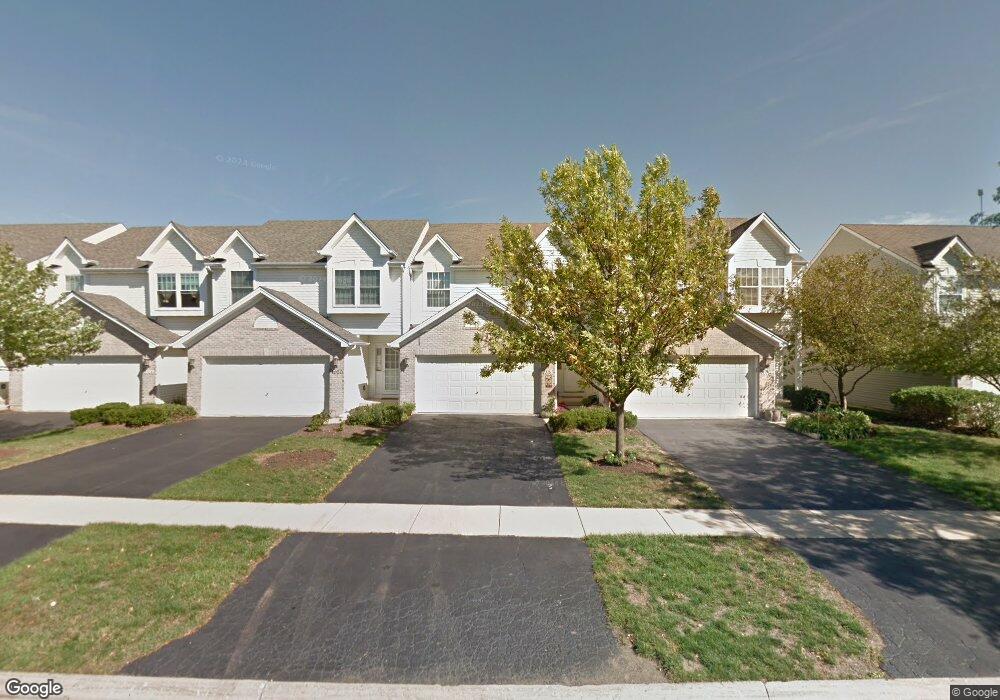
1018 Viewpoint Dr Lake In the Hills, IL 60156
Estimated Value: $274,556 - $289,000
2
Beds
2
Baths
1,725
Sq Ft
$163/Sq Ft
Est. Value
About This Home
This home is located at 1018 Viewpoint Dr, Lake In the Hills, IL 60156 and is currently estimated at $281,139, approximately $162 per square foot. 1018 Viewpoint Dr is a home located in McHenry County with nearby schools including Westfield Community School, Lake in the Hills Elementary School, and United Junior High School.
Ownership History
Date
Name
Owned For
Owner Type
Purchase Details
Closed on
Oct 20, 2003
Sold by
Villamar Ruben and Villamar Elia
Bought by
Villamar Ruben and Villamar Elia
Current Estimated Value
Purchase Details
Closed on
Nov 15, 2001
Sold by
Villamar Ruben
Bought by
Villamar Ruben and Torres Elia
Purchase Details
Closed on
Aug 23, 2001
Sold by
Herron Auburn Patrick
Bought by
Villamar Ruben
Home Financials for this Owner
Home Financials are based on the most recent Mortgage that was taken out on this home.
Original Mortgage
$143,115
Outstanding Balance
$55,342
Interest Rate
7.03%
Mortgage Type
FHA
Estimated Equity
$225,797
Purchase Details
Closed on
May 8, 1998
Sold by
Windmere Cove Partners Inc
Bought by
Herron Auburn Patrick
Home Financials for this Owner
Home Financials are based on the most recent Mortgage that was taken out on this home.
Original Mortgage
$133,078
Interest Rate
7.27%
Mortgage Type
FHA
Create a Home Valuation Report for This Property
The Home Valuation Report is an in-depth analysis detailing your home's value as well as a comparison with similar homes in the area
Home Values in the Area
Average Home Value in this Area
Purchase History
| Date | Buyer | Sale Price | Title Company |
|---|---|---|---|
| Villamar Ruben | -- | -- | |
| Villamar Ruben | -- | -- | |
| Villamar Ruben | $160,000 | -- | |
| Herron Auburn Patrick | $135,000 | Chicago Title |
Source: Public Records
Mortgage History
| Date | Status | Borrower | Loan Amount |
|---|---|---|---|
| Open | Villamar Ruben | $143,115 | |
| Previous Owner | Herron Auburn Patrick | $133,078 |
Source: Public Records
Tax History Compared to Growth
Tax History
| Year | Tax Paid | Tax Assessment Tax Assessment Total Assessment is a certain percentage of the fair market value that is determined by local assessors to be the total taxable value of land and additions on the property. | Land | Improvement |
|---|---|---|---|---|
| 2024 | $5,958 | $82,468 | $15,727 | $66,741 |
| 2023 | $5,648 | $73,757 | $14,066 | $59,691 |
| 2022 | $5,294 | $65,792 | $12,695 | $53,097 |
| 2021 | $5,078 | $61,293 | $11,827 | $49,466 |
| 2020 | $4,946 | $59,123 | $11,408 | $47,715 |
| 2019 | $4,838 | $56,588 | $10,919 | $45,669 |
| 2018 | $4,615 | $52,275 | $10,087 | $42,188 |
| 2017 | $4,510 | $49,247 | $9,503 | $39,744 |
| 2016 | $4,426 | $46,189 | $8,913 | $37,276 |
| 2013 | -- | $52,832 | $8,315 | $44,517 |
Source: Public Records
Map
Nearby Homes
- 937 Mesa Dr
- 900 Windstone Ct
- 809 Menominee Dr
- 807 Menominee Dr
- 7 Michael Ct
- 909 Roger St
- 16 Brian Ct
- LOT 3 Blackhawk Dr
- 992 Mcphee Dr
- 266 Grandview Ct
- 1049 Horizon Ridge
- 1431 Essex St
- 721 Brentwood Ct
- lot 021 Route 31 Hwy
- Lots 10 & 11 Ramble Rd
- 70 Hilltop Dr Unit 4
- 1235 Fairmont Ct
- 10401 Kenilworth Ave
- 420 N Harrison St
- 1019 Maple St
- 1020 Viewpoint Dr
- 1022 Viewpoint Dr
- 1014 Viewpoint Dr
- 1024 Viewpoint Dr
- 1012 Viewpoint Dr
- 1010 Viewpoint Dr
- 1028 Viewpoint Dr
- 1008 Viewpoint Dr
- 991 Mesa Dr
- 991 Mesa Dr Unit 991
- 1030 Viewpoint Dr
- 1006 Viewpoint Dr
- 989 Mesa Dr
- 1031 Viewpoint Dr
- 1032 Viewpoint Dr
- 1003 Viewpoint Dr
- 1003 Viewpoint Dr Unit 1003
- 1001 Viewpoint Dr
- 1033 Viewpoint Dr
- 985 Mesa Dr